Daniocell
vav2 (mesenchyme)
vav 2 guanine nucleotide exchange factor
ZFIN
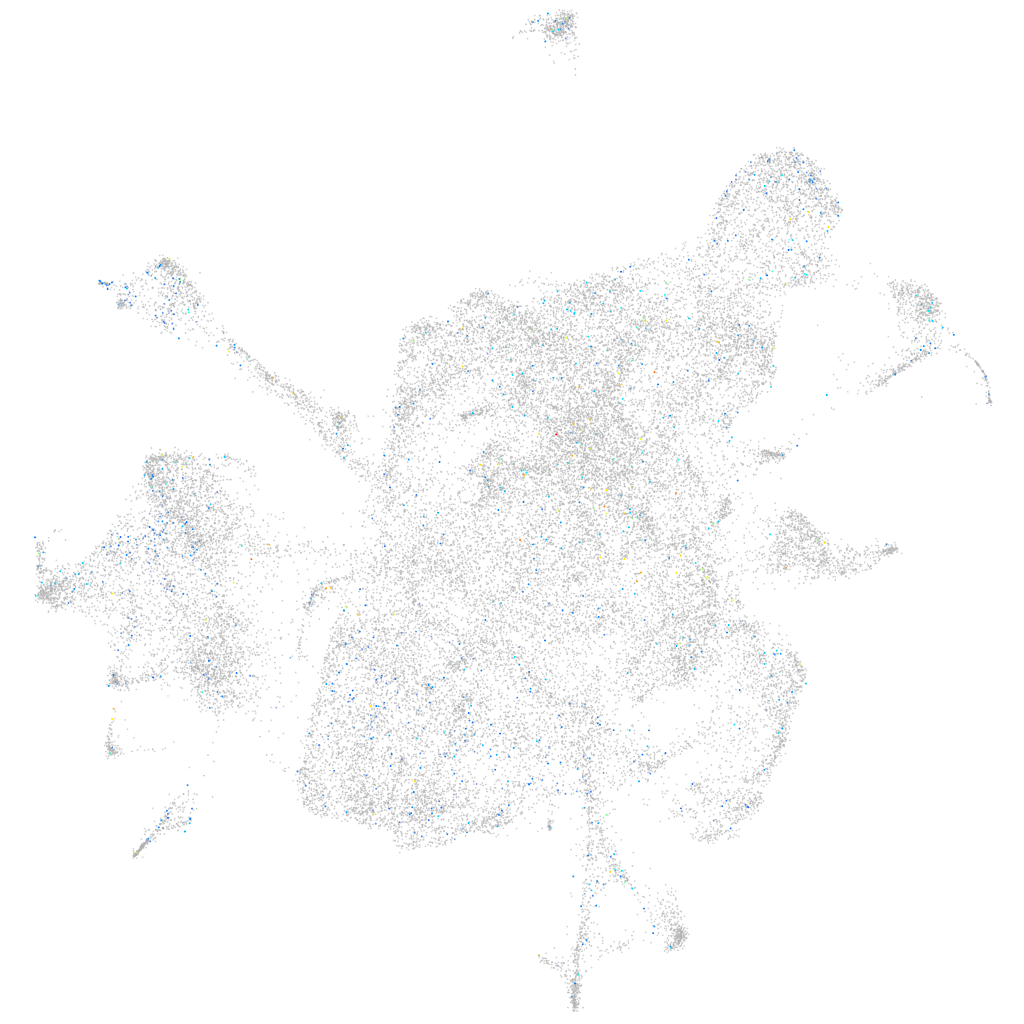
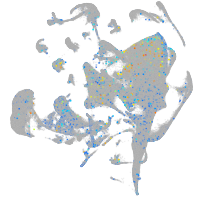
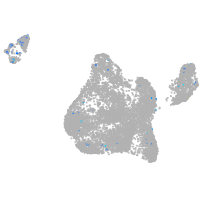
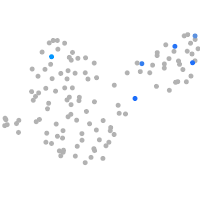
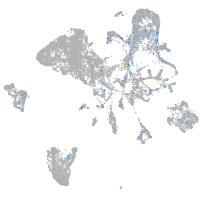
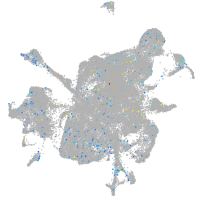
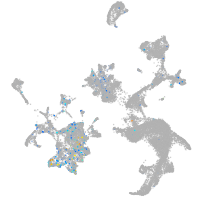
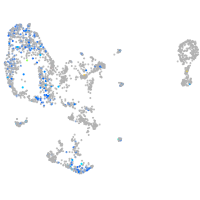
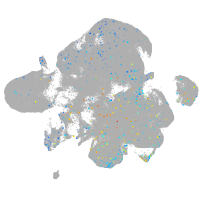
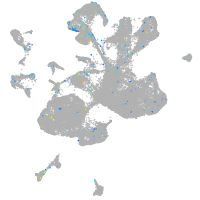
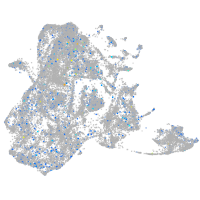
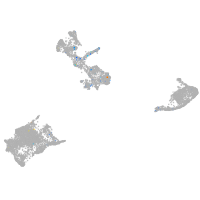
Gene expression UMAP
Display:
Expression
Stage
Other cell groups
all cells
blastomeres
PGCs
endoderm
axial mesoderm
muscle
mural cells /
non-skeletal muscle
mesenchyme
hematopoietic /
vasculature
pronephros
neural
spinal cord / glia
eye
taste / olfactory
otic / lateral line
epidermis
periderm
fin
ionocytes / mucous
pigment cells
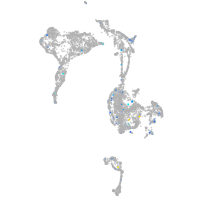
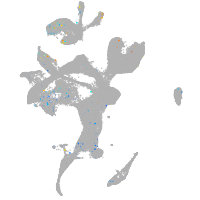
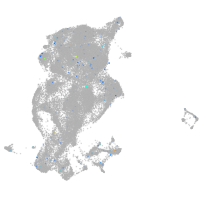
Expression by stage/cluster
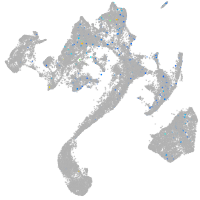
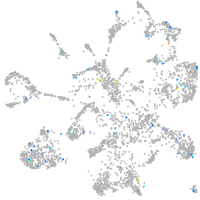
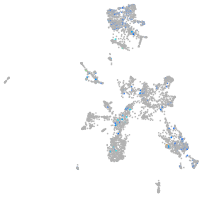
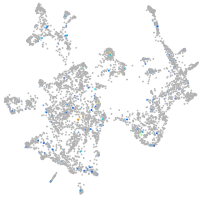
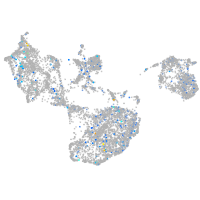
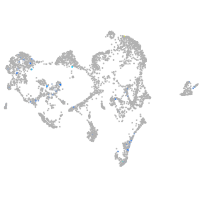
Correlated gene expression
Positive correlation
Negative correlation
Gene
r
Gene
r
XLOC-026554
0.067
rps12
-0.039
rab38b
0.064
rps20
-0.039
LOC108179338
0.064
rpl27a
-0.038
LOC101882775
0.064
rpl27
-0.037
LOC110438615
0.064
rpl19
-0.037
CR925761.2
0.060
rps21
-0.035
taar16a
0.059
rpl21
-0.035
CU915770.1
0.056
rps23
-0.035
mhc1lia
0.056
rpl23
-0.035
XLOC-001155
0.053
rpl38
-0.034
CABZ01056275.1
0.052
si:dkey-151g10.6
-0.034
si:dkey-261m9.9.4
0.051
rps7
-0.034
LOC110439893
0.050
rpl22
-0.033
or104-1
0.048
rps13
-0.033
si:dkey-211g8.4
0.047
rps15a
-0.032
gbe1a
0.047
rplp1
-0.032
LOC108183380
0.047
rpl10a
-0.032
mlana
0.047
rps27.1
-0.032
zgc:158463
0.045
rpl39
-0.030
si:ch211-195b15.7
0.045
rpl37
-0.030
CABZ01081830.2
0.044
rpl9
-0.030
LOC108181095
0.044
rpl10
-0.030
XLOC-034550
0.044
rpl7
-0.030
faslg
0.043
zgc:114188
-0.029
BX510649.1
0.043
rps28
-0.029
XLOC-001707
0.042
rpl36a
-0.029
mir375-2
0.042
rps5
-0.029
LOC100006895
0.042
rpl7a
-0.028
tkta
0.042
rps3a
-0.028
BX663605.1
0.041
eef1b2
-0.028
trpv4
0.040
rps14
-0.027
dlgap2a
0.040
rpl35a
-0.027
fam169b
0.040
rplp2l
-0.027
thrap3a
0.040
rps9
-0.027
si:dkey-65b12.10
0.039
rpl26
-0.026