Daniocell
vat1l (otic / lateral line)
vesicle amine transport 1-like
ZFIN
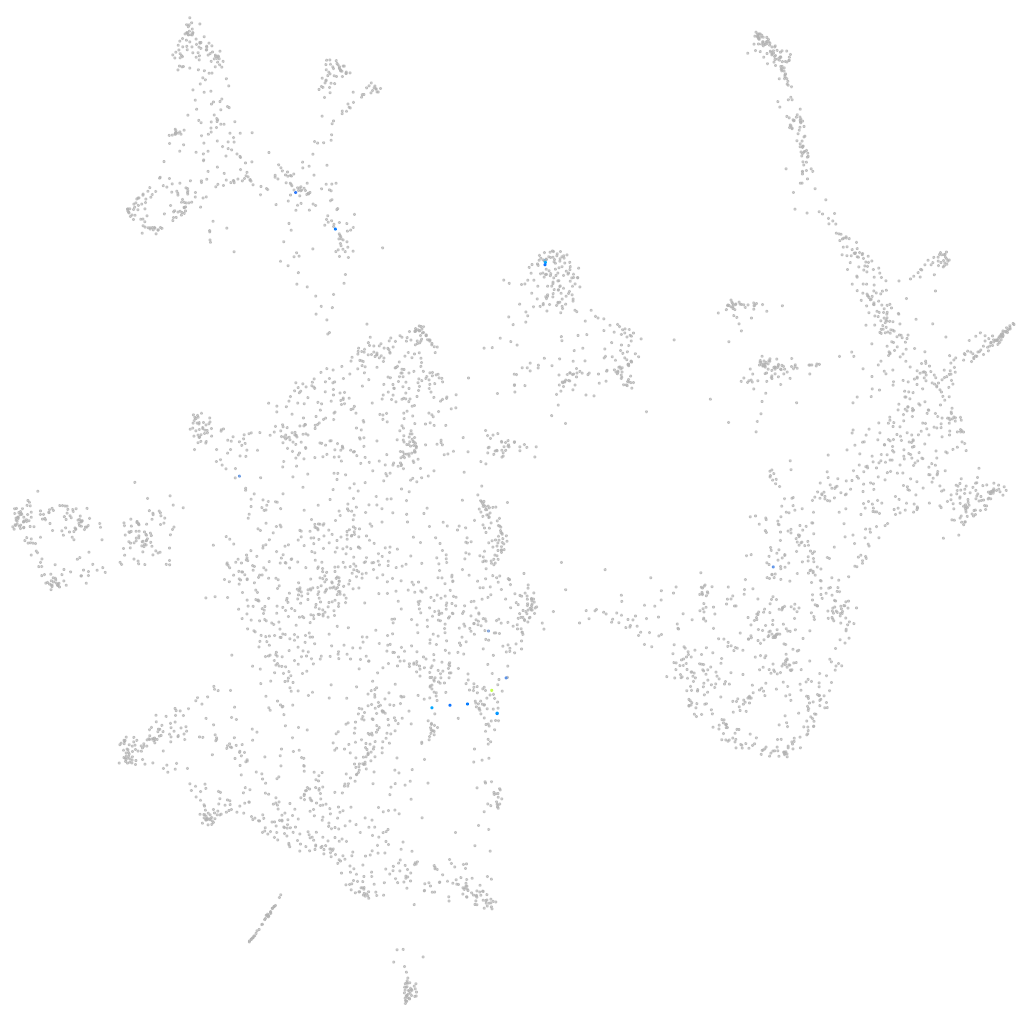
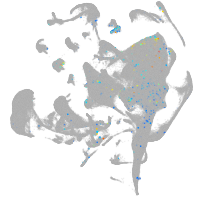
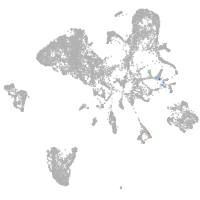
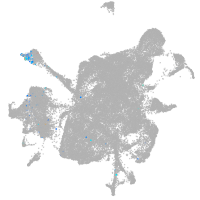
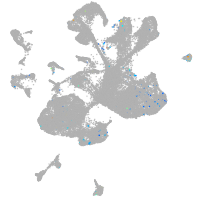
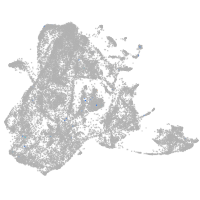
Gene expression UMAP
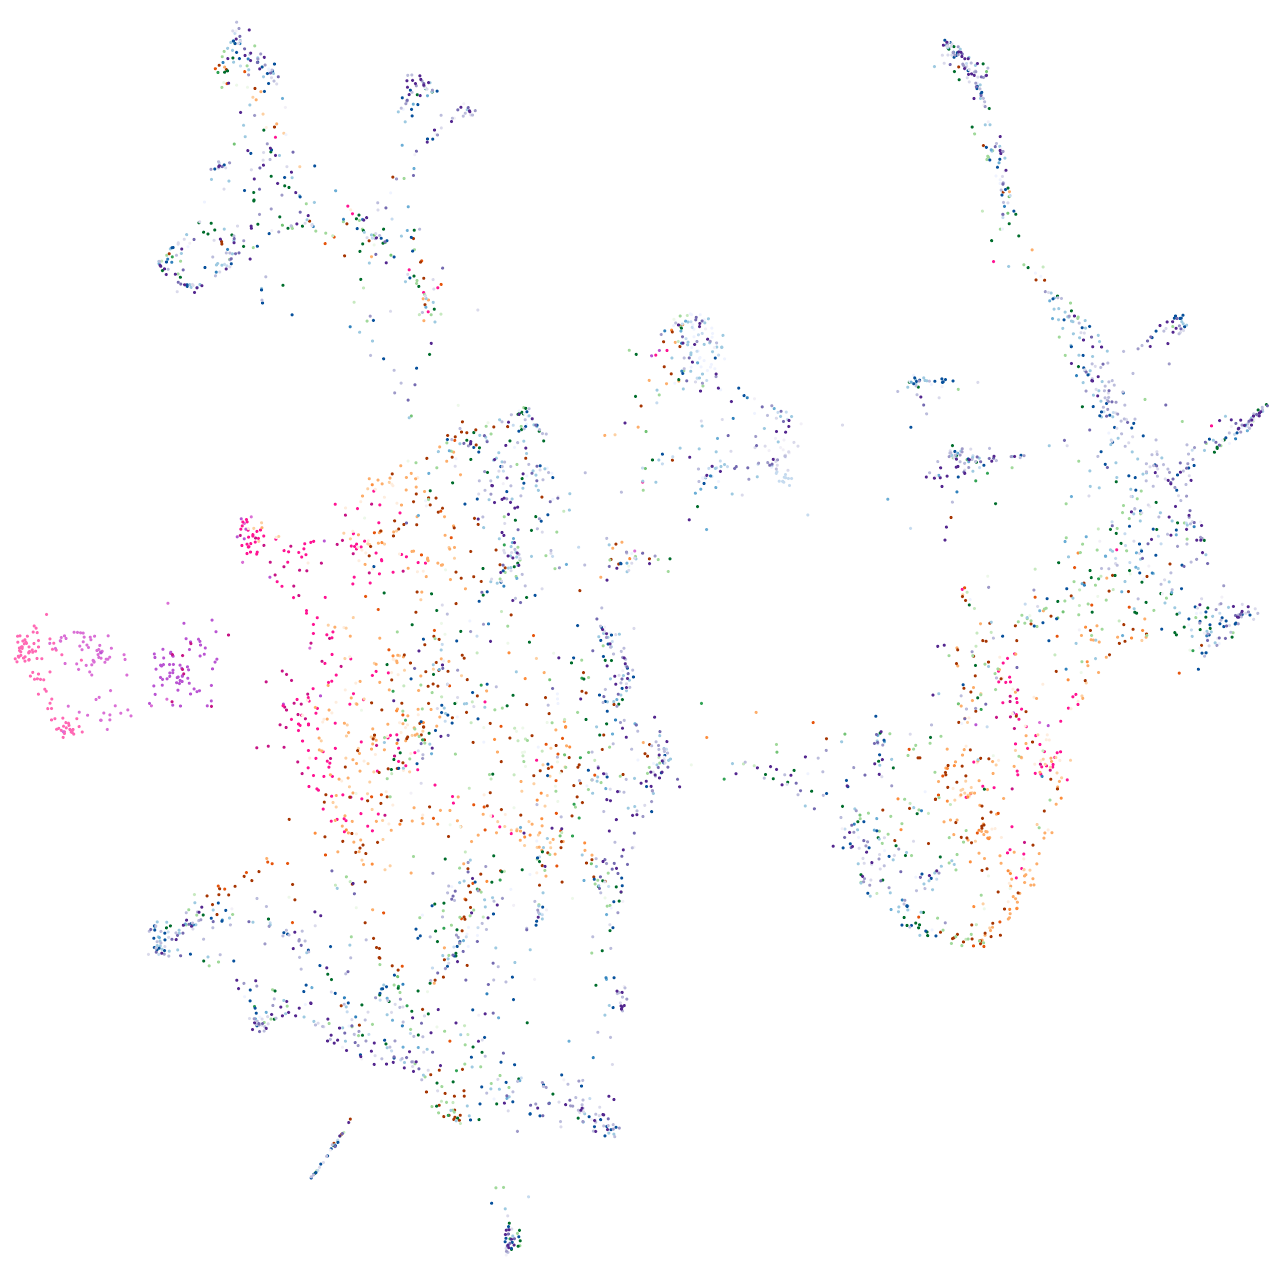
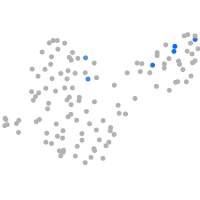
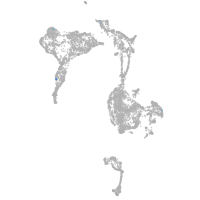
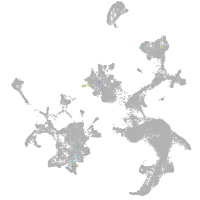
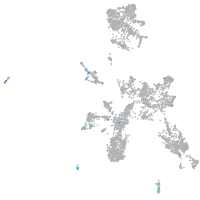
Display:
Expression
Stage
Other cell groups
all cells
blastomeres
PGCs
endoderm
axial mesoderm
muscle
mural cells /
non-skeletal muscle
mesenchyme
hematopoietic /
vasculature
pronephros
neural
spinal cord / glia
eye
taste / olfactory
otic / lateral line
epidermis
periderm
fin
ionocytes / mucous
pigment cells
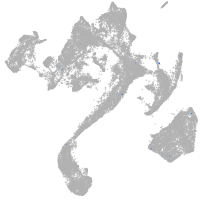
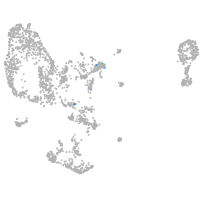
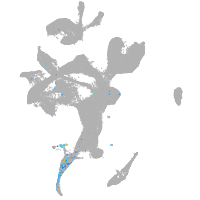
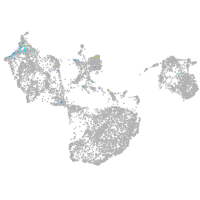
Expression by stage/cluster
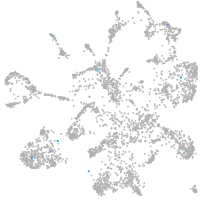
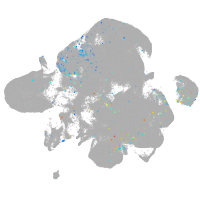
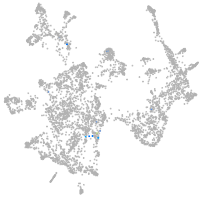
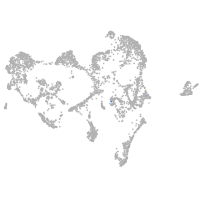
Correlated gene expression
Positive correlation
Negative correlation
Gene
r
Gene
r
LOC110438761
0.463
fthl27
-0.037
igf3
0.455
epcam
-0.036
LOC101886687
0.391
cldnb
-0.035
cacna1sa
0.324
cxcl14
-0.034
si:ch1073-441p17.1
0.322
si:dkey-222f2.1
-0.034
si:ch211-211k8.12
0.296
her15.1
-0.033
hoxb6b
0.267
zgc:158343
-0.032
cart2
0.259
perp
-0.032
zgc:114181
0.257
f11r.1
-0.032
hhla2b.2
0.255
anxa4
-0.031
XLOC-011522
0.250
pnrc2
-0.031
illr3
0.241
sdc4
-0.031
XLOC-043669
0.232
vamp3
-0.031
LOC110439480
0.220
dnase1l4.1
-0.031
CR352209.1
0.216
tp53inp1
-0.031
mxra8a
0.215
gsnb
-0.031
c8g
0.213
pabpc1a
-0.031
zgc:165508
0.213
sox2
-0.030
htr1ab
0.199
fosab
-0.030
zgc:158404
0.182
rnaseka
-0.030
XLOC-016045
0.178
icn
-0.029
ubash3bb
0.177
ube2d1a
-0.029
XLOC-043218
0.168
sri
-0.029
CR854907.1
0.166
gsta.1
-0.029
mhc1zda
0.165
selenom
-0.029
XLOC-017847
0.163
si:ch211-153b23.5
-0.029
si:ch1073-513e17.1
0.159
krt18b
-0.029
prph
0.155
cldn7b
-0.028
si:dkey-73n10.1
0.150
oclna
-0.028
LOC103910472
0.148
tagln2
-0.028
dner
0.148
svopl
-0.028
lbx2
0.148
atp5mea
-0.028
cetp
0.148
luc7l
-0.028
mb21d2
0.146
pvalb8
-0.028
FP102018.1
0.145
fgf10a
-0.028