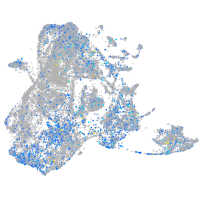
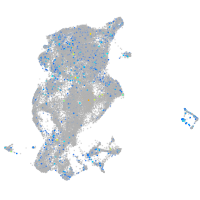
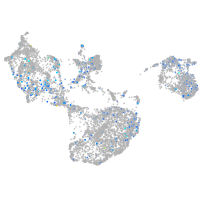
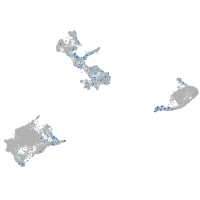
UTP25 small subunit processor component
ZFIN 
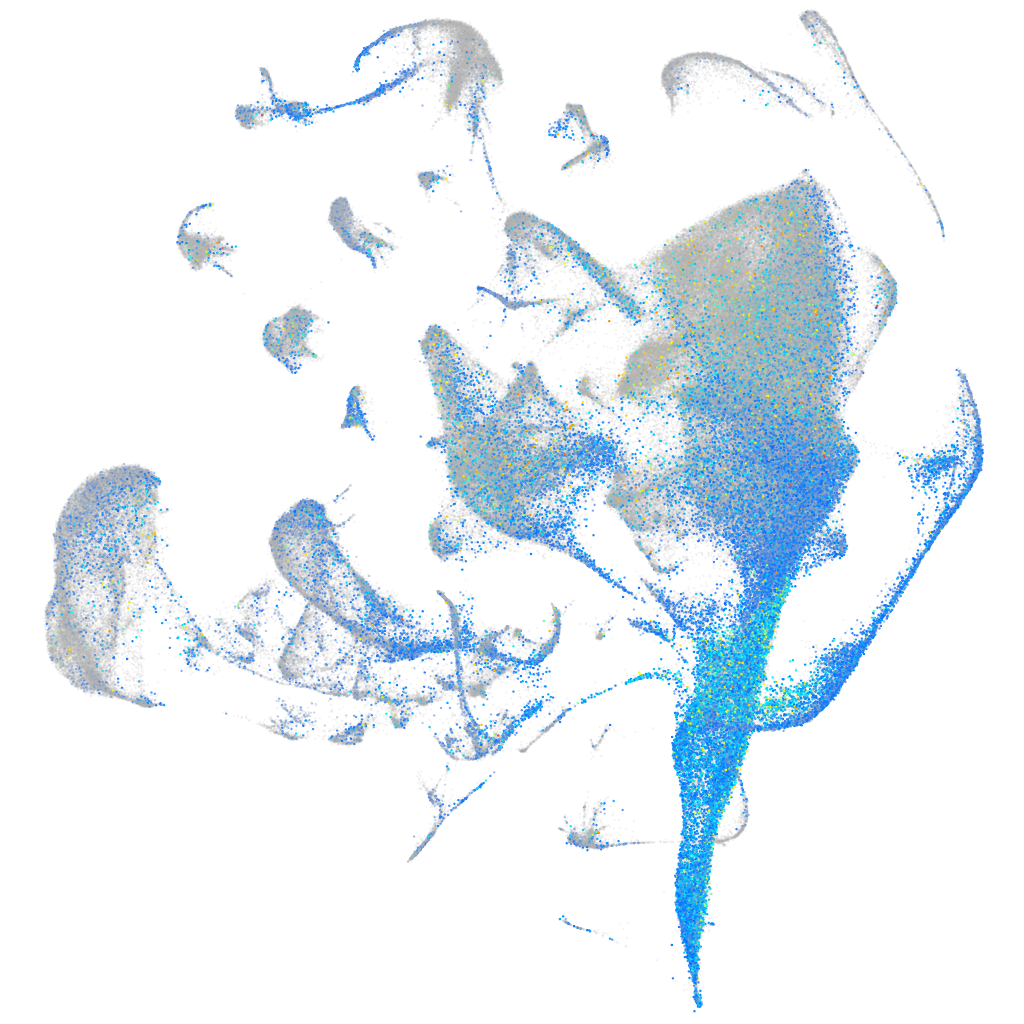
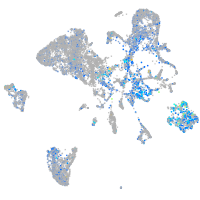
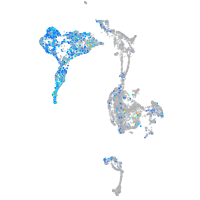
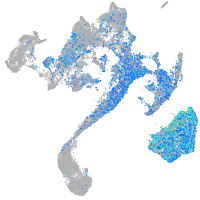
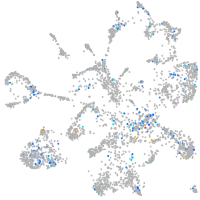
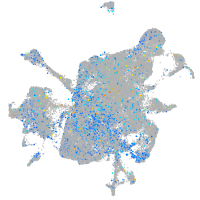
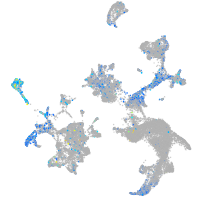
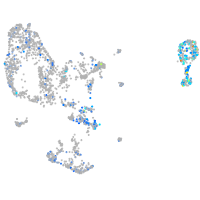
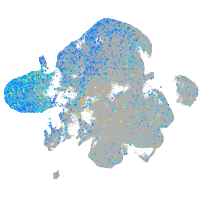
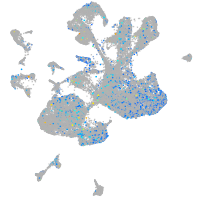
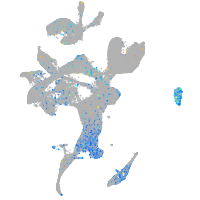
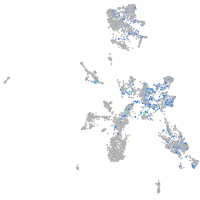
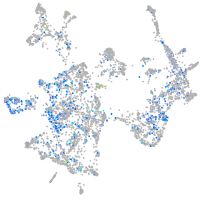
Expression by stage/cluster


Correlated gene expression


| Positive correlation | Negative correlation | ||
| Gene | r | Gene | r |
| npm1a | 0.344 | ccni | -0.132 |
| dkc1 | 0.333 | pvalb1 | -0.125 |
| nop58 | 0.333 | krt4 | -0.121 |
| fbl | 0.330 | pvalb2 | -0.121 |
| ncl | 0.317 | cyt1 | -0.117 |
| hspb1 | 0.309 | calm1a | -0.113 |
| nop56 | 0.309 | hbbe1.3 | -0.111 |
| nop2 | 0.304 | gapdhs | -0.109 |
| snu13b | 0.300 | gpm6aa | -0.109 |
| bms1 | 0.293 | cyt1l | -0.107 |
| gnl3 | 0.289 | hbae3 | -0.105 |
| ebna1bp2 | 0.286 | rnasekb | -0.105 |
| pprc1 | 0.284 | rtn1a | -0.105 |
| gar1 | 0.282 | tuba1c | -0.105 |
| nhp2 | 0.281 | actc1b | -0.103 |
| ddx18 | 0.280 | marcksl1a | -0.103 |
| rrp1 | 0.274 | si:ch1073-429i10.3.1 | -0.102 |
| rsl1d1 | 0.272 | ckbb | -0.101 |
| zmp:0000000624 | 0.270 | icn | -0.100 |
| mphosph10 | 0.266 | stmn1b | -0.099 |
| pes | 0.265 | atp6v1e1b | -0.097 |
| wdr43 | 0.262 | atp6v1g1 | -0.096 |
| nop10 | 0.260 | wu:fb55g09 | -0.096 |
| polr3gla | 0.260 | hbae1.1 | -0.095 |
| mybbp1a | 0.259 | anxa1a | -0.094 |
| nolc1 | 0.258 | elavl3 | -0.094 |
| hnrnpa1b | 0.257 | tob1b | -0.094 |
| lyar | 0.257 | dap1b | -0.094 |
| ppig | 0.256 | atp6v0cb | -0.093 |
| si:ch211-152c2.3 | 0.256 | gpm6ab | -0.093 |
| si:ch211-217k17.7 | 0.253 | s100a10b | -0.092 |
| rrs1 | 0.250 | icn2 | -0.091 |
| stm | 0.249 | tmem59 | -0.091 |
| ddx27 | 0.248 | gabarapl2 | -0.090 |
| kri1 | 0.247 | si:ch211-195b11.3 | -0.090 |


