Daniocell
utp20 (taste / olfactory)
UTP20 small subunit processome component
ZFIN
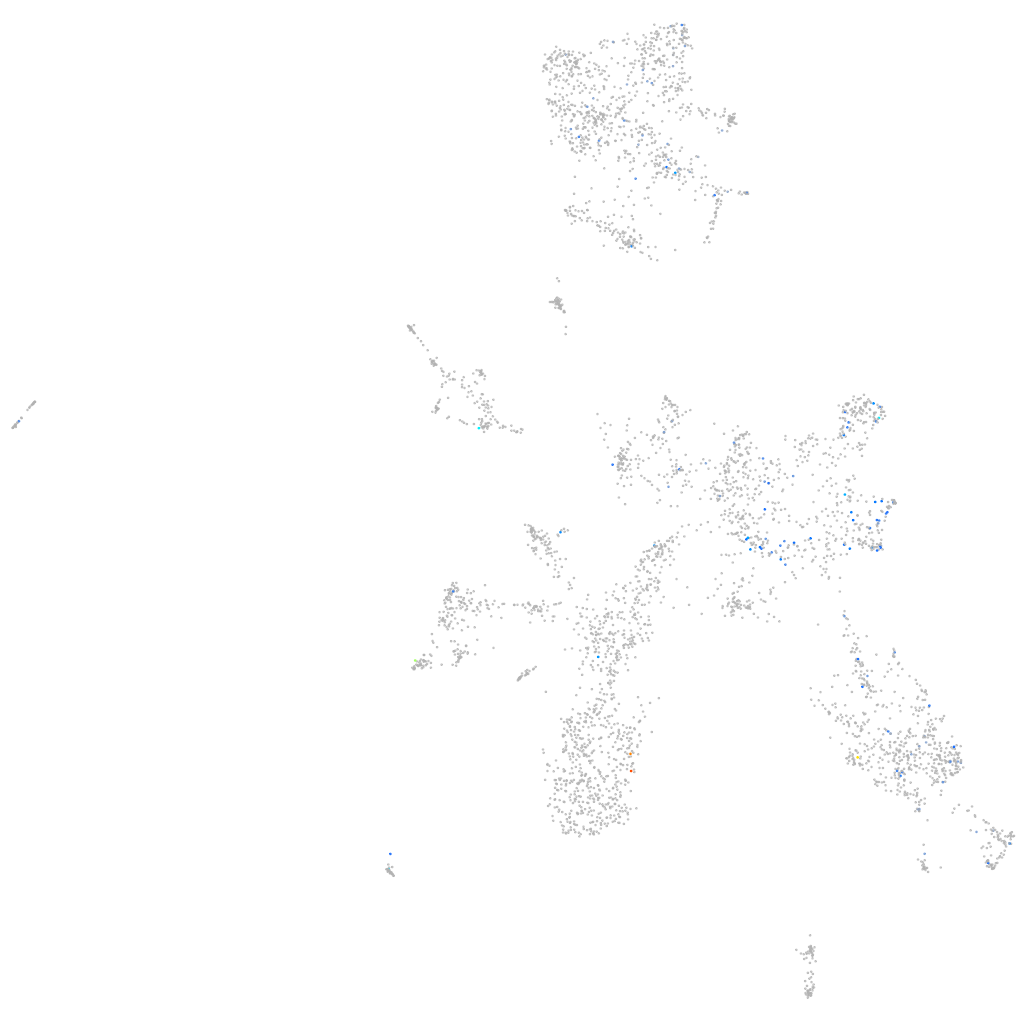
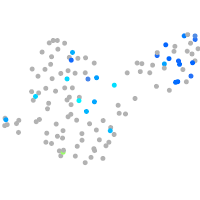
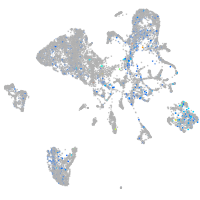
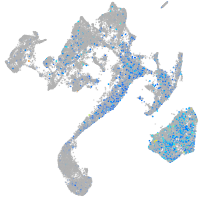
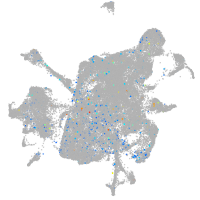
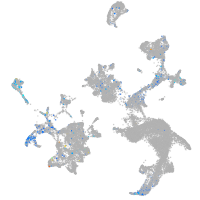
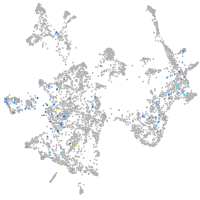
Gene expression UMAP
Display:
Expression
Stage
Other cell groups
all cells
blastomeres
PGCs
endoderm
axial mesoderm
muscle
mural cells /
non-skeletal muscle
mesenchyme
hematopoietic /
vasculature
pronephros
neural
spinal cord / glia
eye
taste / olfactory
otic / lateral line
epidermis
periderm
fin
ionocytes / mucous
pigment cells
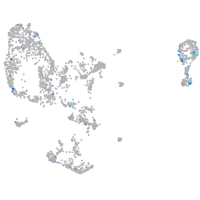
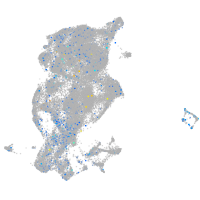
Expression by stage/cluster
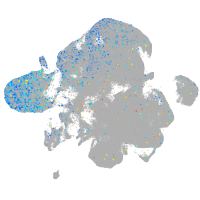
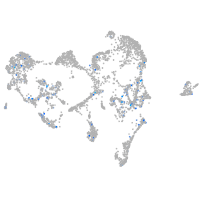
Correlated gene expression
Positive correlation
Negative correlation
Gene
r
Gene
r
LOC103909160
0.333
tmem59
-0.082
crfb15
0.296
rnasekb
-0.081
LOC108181174
0.285
calm1a
-0.078
sec24d
0.280
selenow1
-0.074
LOC100538188
0.257
txn
-0.071
XLOC-028454
0.224
anxa5b
-0.070
BX901942.1
0.203
tuba1c
-0.067
CABZ01073033.1
0.200
stmn1b
-0.067
LOC101885479.1
0.199
vamp2
-0.066
XLOC-031367
0.199
ip6k2a
-0.066
LOC110438502
0.197
smkr1
-0.066
LOC110439379
0.195
smdt1b
-0.065
ptpn12
0.189
si:ch1073-443f11.2
-0.064
rxfp3
0.188
cldnh
-0.064
si:ch211-119e14.1
0.186
histh1l
-0.064
si:dkey-76k16.5
0.185
si:ch211-195b15.8
-0.064
pcdh2g3
0.177
htatip2
-0.063
LOC100006699
0.168
gnb1a
-0.063
ppox
0.167
atp6v0cb
-0.062
XLOC-039113
0.167
ptmaa
-0.062
LOC108183290
0.165
gabarapa
-0.062
LOC103909382
0.163
reep5
-0.062
si:dkey-172k15.11
0.161
atp6v1g1
-0.062
XLOC-017014
0.157
si:dkey-28b4.7
-0.062
c7a
0.154
anxa13l
-0.061
supv3l1
0.151
bik
-0.061
mhc1lfa
0.151
arl6ip1
-0.061
FO704721.2
0.150
scg2a
-0.061
si:dkey-286j17.4
0.147
atp2b1b
-0.060
eps8l3a
0.144
calm1b
-0.060
asic1b
0.143
mycbp
-0.060
BX677668.1
0.143
ckbb
-0.060
si:ch73-50f9.4
0.141
tnrc6c1
-0.059
LOC110438360
0.140
arpc3
-0.059
smurf2
0.139
bdnf
-0.058