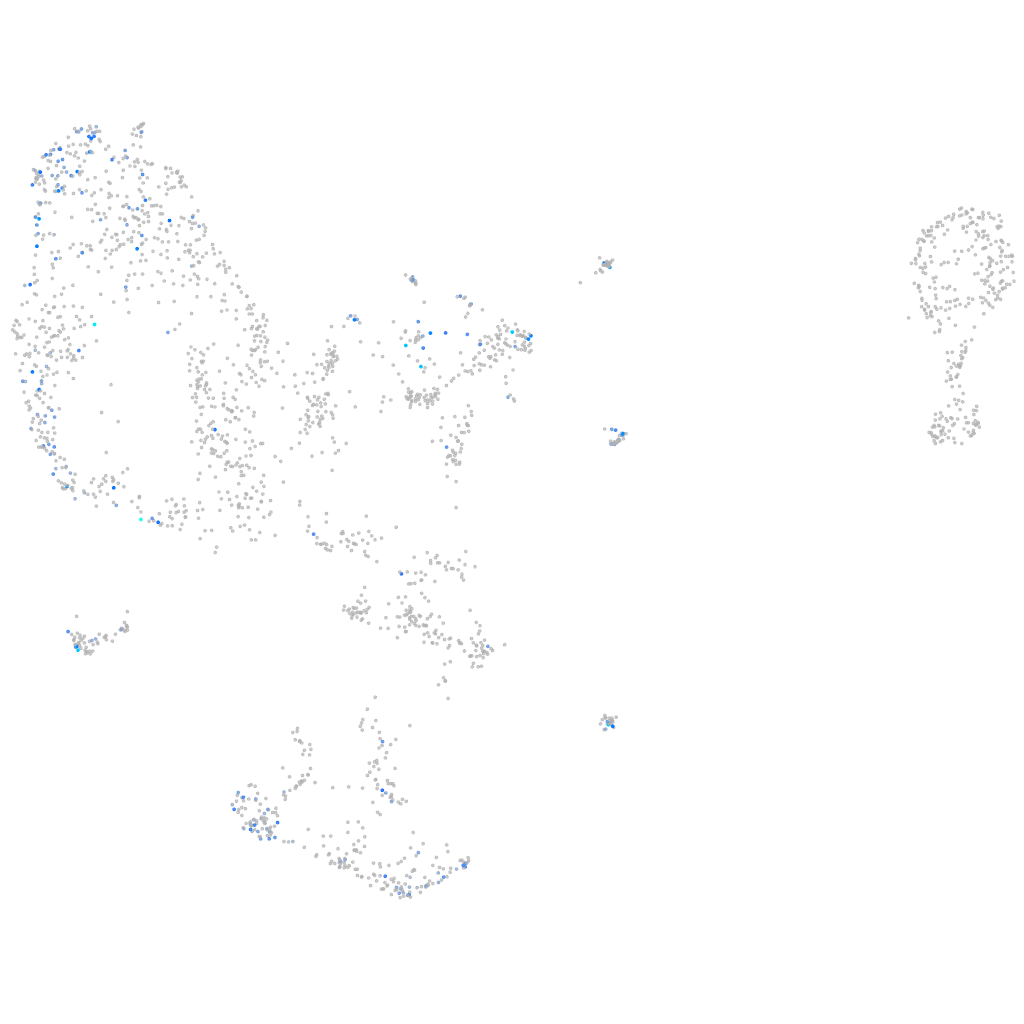
Daniocell
ulk2 (pronephros)
unc-51 like autophagy activating kinase 2
ZFIN
Gene expression UMAP
Display:
Expression
Stage
Other cell groups
all cells
blastomeres
PGCs
endoderm
axial mesoderm
muscle
mural cells /
non-skeletal muscle
mesenchyme
hematopoietic /
vasculature
pronephros
neural
spinal cord / glia
eye
taste / olfactory
otic / lateral line
epidermis
periderm
fin
ionocytes / mucous
pigment cells
Expression by stage/cluster
Correlated gene expression
Positive correlation
Negative correlation
Gene
r
Gene
r
pdk2b
0.202
si:ch211-222l21.1
-0.154
znf993
0.201
hmga1a
-0.131
LOC110438492
0.198
wu:fb97g03
-0.122
BX649442.1
0.196
snrpg
-0.120
cebpd
0.189
nucks1a
-0.118
si:dkeyp-26a9.7
0.189
hspb1
-0.115
lrig3.1
0.185
hmgn6
-0.114
dbpb
0.185
si:ch73-281n10.2
-0.111
apoa1b
0.183
ptmab
-0.111
LOC108179692
0.181
zgc:110425
-0.111
si:ch211-188c18.1
0.181
si:ch73-1a9.3
-0.108
zgc:114120
0.181
aqp8b
-0.106
LOC101884617
0.180
hnrnpub
-0.106
nitr13
0.178
cirbpb
-0.106
alox5b.3
0.177
hmgb2a
-0.105
zbtb24
0.177
NC-002333.4
-0.105
lxn
0.176
eif2s2
-0.105
XLOC-030027
0.176
h3f3d
-0.103
CR847970.1
0.174
ptges3b
-0.103
si:ch73-334d15.4
0.174
hnrnpabb
-0.103
BX248238.1
0.174
cx43.4
-0.102
LOC110439526
0.174
h2afvb
-0.101
si:dkey-15h8.17
0.174
sae1
-0.101
si:cabz01071911.4
0.173
ube2v2
-0.098
rxrab
0.173
hmgb2b
-0.098
mybpc1
0.172
nop58
-0.097
slc22a2
0.172
ddx39ab
-0.097
cdkn1a
0.171
hdac1
-0.096
sod1
0.171
BX927258.1
-0.096
LOC101886880
0.167
snrpb
-0.095
nudt14
0.167
si:dkeyp-27c8.2
-0.095
zgc:64189
0.166
seta
-0.095
BX901962.1
0.161
lmo2
-0.095
TCERG1L
0.161
apoc1
-0.095
slc47a4
0.161
eif5a2
-0.094