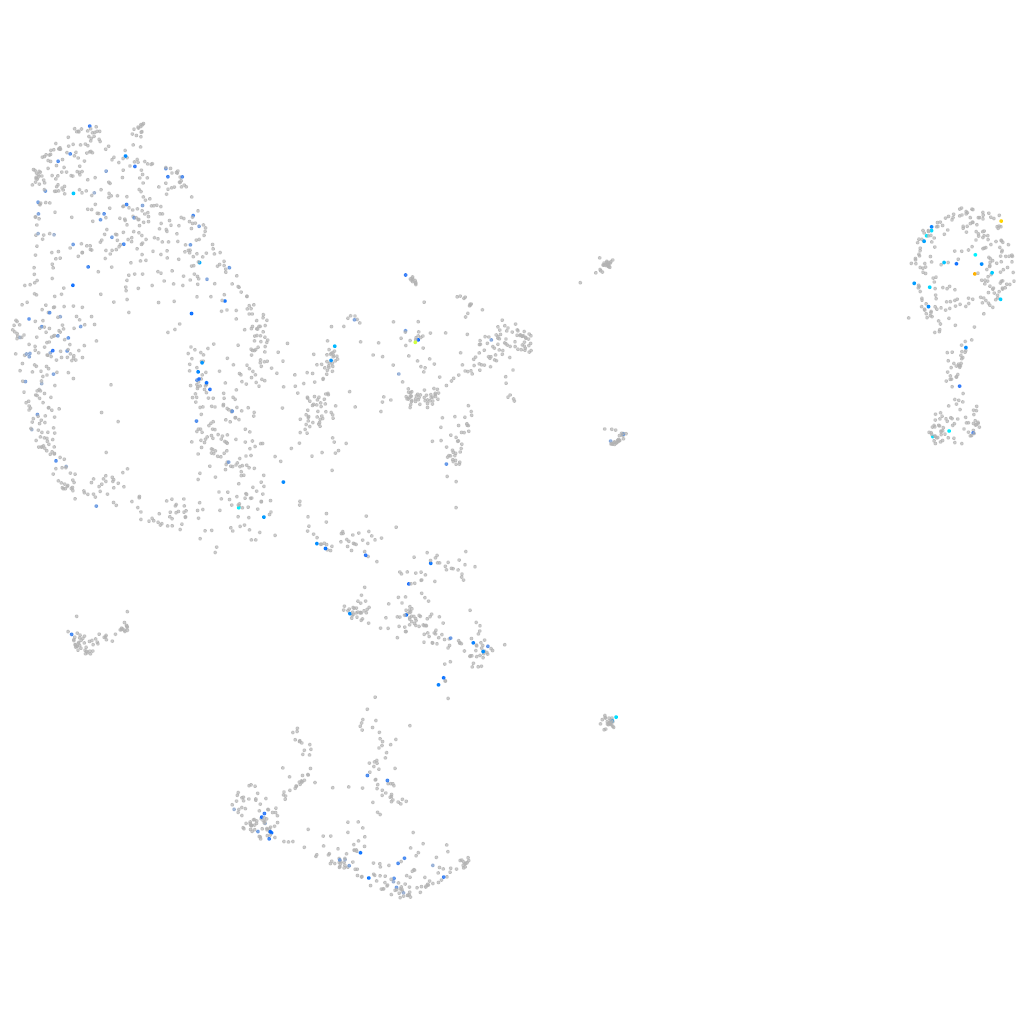
Daniocell
tyw5 (pronephros)
tRNA-yW synthesizing protein 5
ZFIN
Gene expression UMAP
Display:
Expression
Stage
Other cell groups
all cells
blastomeres
PGCs
endoderm
axial mesoderm
muscle
mural cells /
non-skeletal muscle
mesenchyme
hematopoietic /
vasculature
pronephros
neural
spinal cord / glia
eye
taste / olfactory
otic / lateral line
epidermis
periderm
fin
ionocytes / mucous
pigment cells
Expression by stage/cluster
Correlated gene expression
Positive correlation
Negative correlation
Gene
r
Gene
r
FO681393.2
0.284
rpl37
-0.085
LOC100538123
0.284
atp5mc3b
-0.078
XLOC-020693
0.249
rps10
-0.072
pimr191
0.234
ptmaa
-0.070
XLOC-032258
0.219
atp1b1a
-0.061
cxcl8b.3
0.214
cox4i1
-0.060
si:dkey-188i13.6
0.214
zgc:114188
-0.060
cyp2aa7
0.209
si:ch1073-429i10.3.1
-0.060
BX539325.1
0.209
h3f3a
-0.059
rac1l
0.200
ckbb
-0.057
ankdd1b
0.198
kif5bb
-0.055
LOC101885341
0.193
ndufa3
-0.053
zmp:0000000735
0.189
zgc:158463
-0.053
c1qtnf2
0.188
elavl3
-0.053
FP236513.1
0.184
mapre2
-0.053
LOC792627
0.181
slc25a3b
-0.053
flnb
0.180
tbl1xr1a
-0.052
si:dkeyp-44a8.4
0.177
morn3
-0.052
CR391977.1
0.177
ywhae1
-0.052
myoz1a
0.174
gpm6ab
-0.052
sema5a
0.171
atp5mc1
-0.051
ntd5
0.170
dcdc2b
-0.051
znf45l
0.169
si:dkey-27p23.3
-0.050
si:ch211-63b16.4
0.168
rps17
-0.050
mfap5
0.168
h1f0
-0.050
otud1
0.167
nr2f6b
-0.050
ARHGAP6
0.161
BX248318.1
-0.049
LOC108184011
0.161
gpm6aa
-0.049
rargb
0.158
slc25a5
-0.049
NAV1
0.157
hbae1.3
-0.049
si:dkey-57k2.6
0.156
fam177a1
-0.049
col18a1b
0.155
tmsb
-0.049
MSANTD2
0.155
zgc:55461
-0.048
mapk13
0.155
atp5meb
-0.048
LOC101884055
0.152
epb41a
-0.048