Daniocell
tyw5 (otic / lateral line)
tRNA-yW synthesizing protein 5
ZFIN
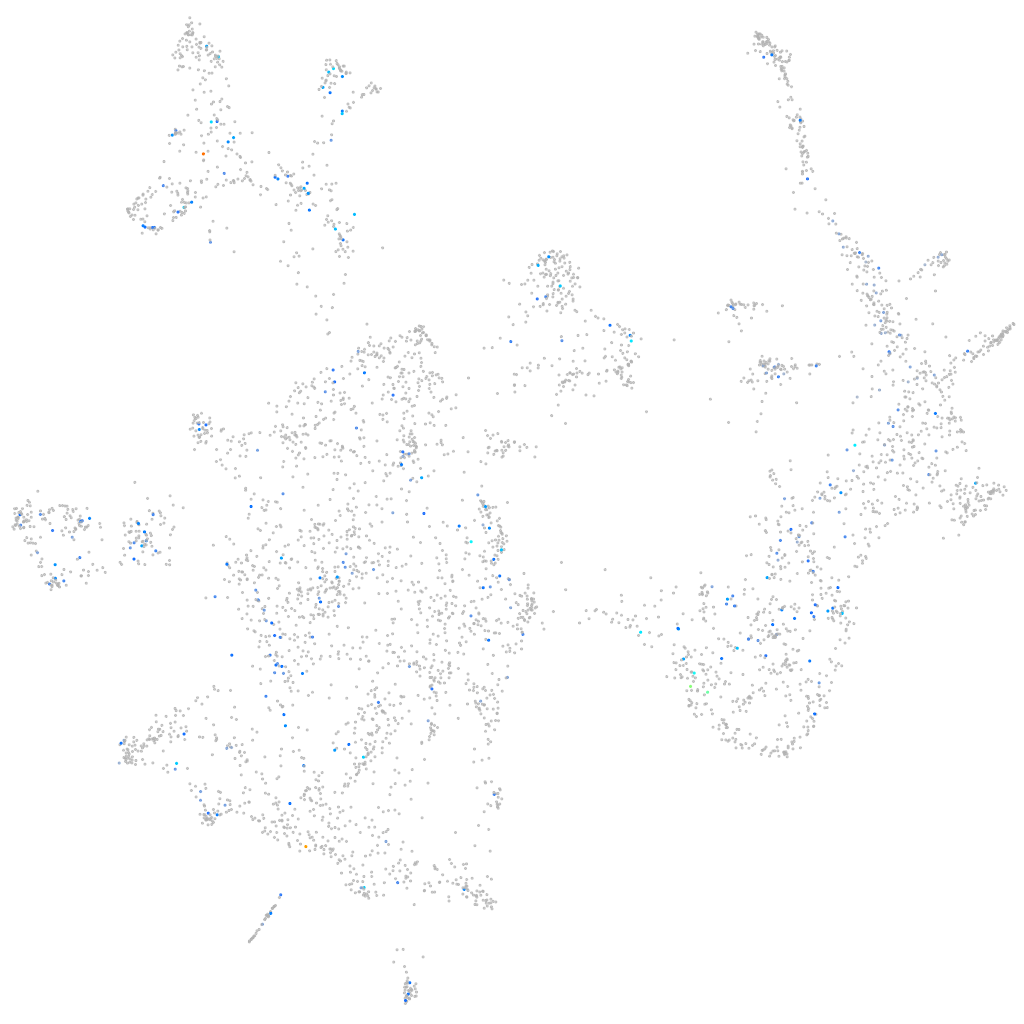
Gene expression UMAP
Display:
Expression
Stage
Other cell groups
all cells
blastomeres
PGCs
endoderm
axial mesoderm
muscle
mural cells /
non-skeletal muscle
mesenchyme
hematopoietic /
vasculature
pronephros
neural
spinal cord / glia
eye
taste / olfactory
otic / lateral line
epidermis
periderm
fin
ionocytes / mucous
pigment cells
Expression by stage/cluster
Correlated gene expression
Positive correlation
Negative correlation
Gene
r
Gene
r
kiss1
0.194
zgc:158463
-0.053
LOC101882775
0.147
CR383676.1
-0.052
cdc42ep3
0.141
atp1a1a.4
-0.043
XLOC-043918
0.126
clstn1
-0.041
BX950224.1
0.124
tmsb4x
-0.040
vmo1a
0.121
prss16
-0.039
XLOC-020687
0.121
LOC110439372
-0.039
tm7sf2
0.119
pank1b
-0.038
steap2
0.118
stm
-0.037
LOC108191752
0.117
glula
-0.037
zgc:171929
0.115
hbbe1.1
-0.037
CR925777.1
0.114
atp1b3b
-0.037
chrnb3a
0.111
si:ch211-103f14.3
-0.037
LOC110440093
0.109
zgc:193505
-0.036
LOC103910662
0.108
slc1a3a
-0.036
XLOC-026153
0.105
tnks1bp1
-0.036
col10a1b
0.104
si:dkey-205h13.2
-0.035
CR384099.1
0.104
dtx4a
-0.035
si:dkey-46g23.2
0.104
pabpc1b
-0.035
LOC100329560
0.102
fndc3ba
-0.035
XLOC-018384
0.102
f10
-0.035
lrpprc
0.101
si:ch211-195b11.3
-0.034
BX537130.1
0.101
tmem47
-0.034
tmtops2a
0.099
bicdl2
-0.034
XLOC-026835
0.098
gli3
-0.034
si:ch73-334d15.4
0.097
ddit3
-0.034
si:ch73-181m17.1
0.096
ephb3
-0.034
mrpl12
0.095
p4hb
-0.034
zgc:112001
0.095
add3a
-0.033
il2rb
0.095
creg1
-0.033
wdr95
0.094
tectb
-0.033
klhl17
0.093
rps28
-0.033
CR352209.1
0.093
limch1b
-0.033
ponzr4
0.092
BX322530.1
-0.033
BX004785.2
0.092
chl1b
-0.033