Daniocell
tsen2 (taste / olfactory)
TSEN2 tRNA splicing endonuclease subunit
ZFIN
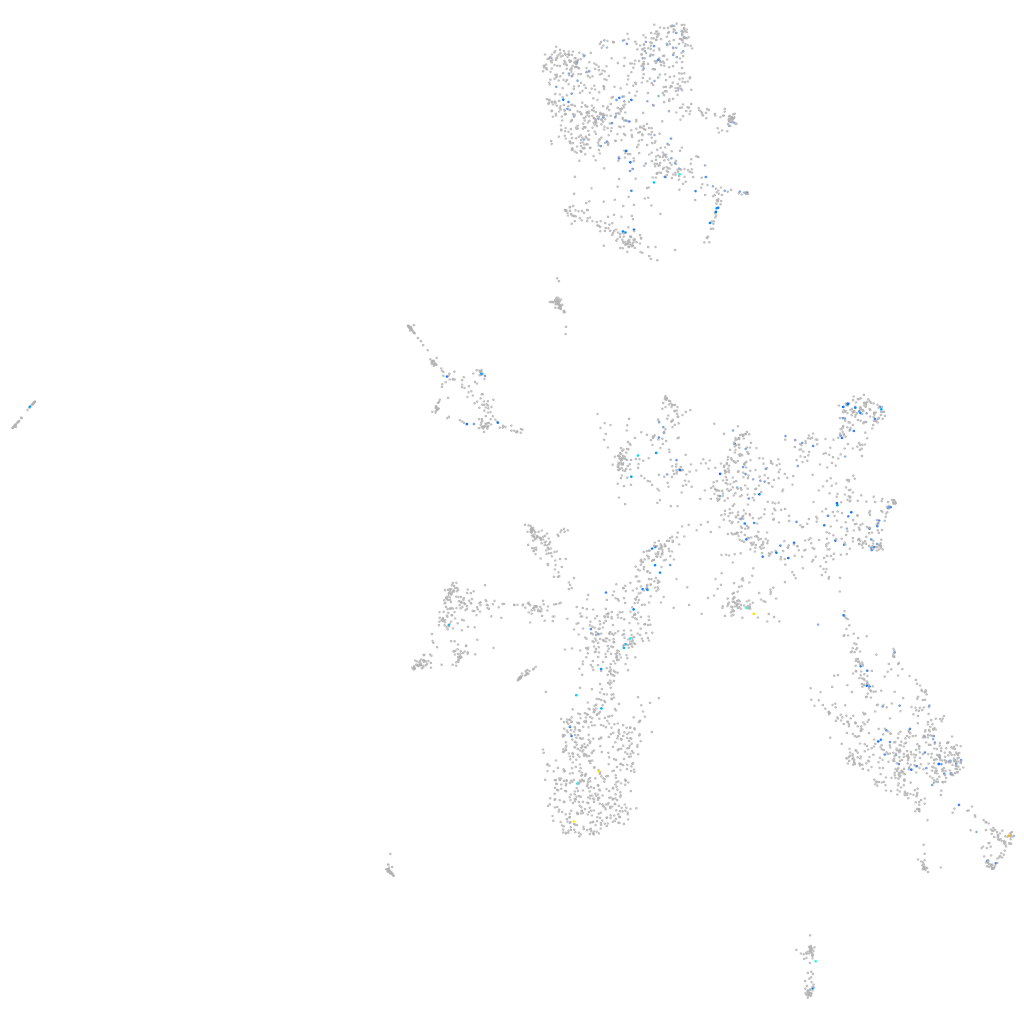
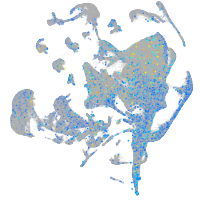
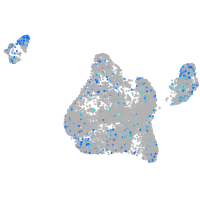
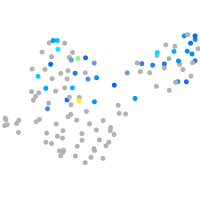
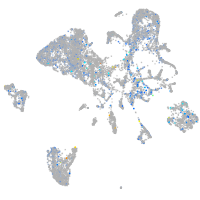
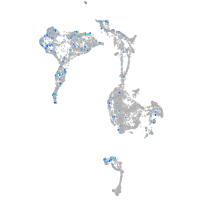
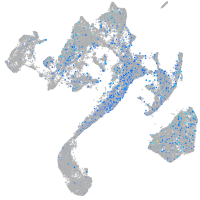
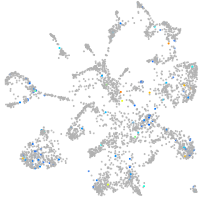
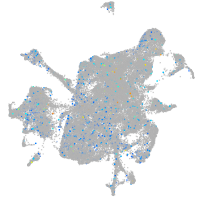
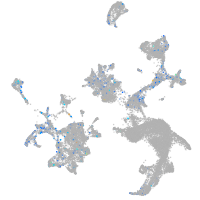
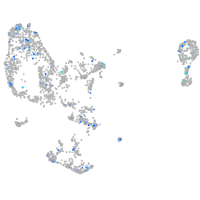
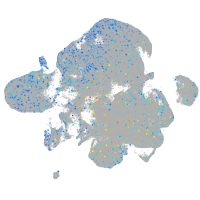
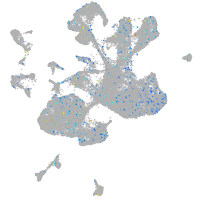
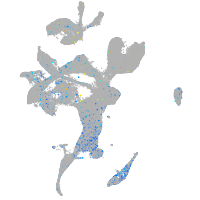
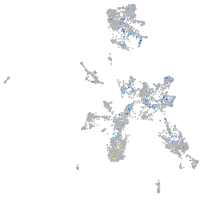
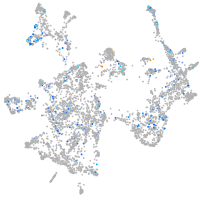
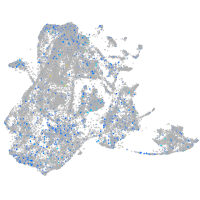
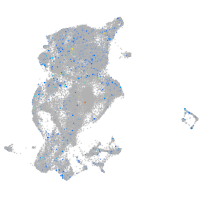
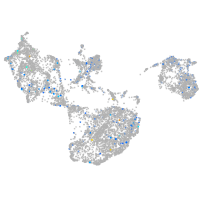
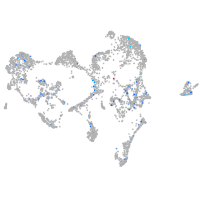
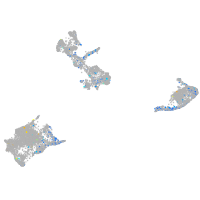
Gene expression UMAP
Display:
Expression
Stage
Other cell groups
all cells
blastomeres
PGCs
endoderm
axial mesoderm
muscle
mural cells /
non-skeletal muscle
mesenchyme
hematopoietic /
vasculature
pronephros
neural
spinal cord / glia
eye
taste / olfactory
otic / lateral line
epidermis
periderm
fin
ionocytes / mucous
pigment cells
Expression by stage/cluster
Correlated gene expression
Positive correlation
Negative correlation
Gene
r
Gene
r
si:ch73-170d6.4
0.238
cldnh
-0.071
XLOC-004189
0.211
camk2n1a
-0.068
zgc:174354
0.200
chga
-0.068
AL954146.1
0.186
hpcal4
-0.059
LOC108182916
0.186
flrt1b
-0.058
si:ch211-244a23.1
0.176
si:dkey-71b5.7
-0.058
ttc41
0.172
txn
-0.058
hdhd5
0.168
zgc:101731
-0.058
CR792422.2
0.162
pvalb5
-0.056
prokr1b
0.162
cbx4
-0.056
FP015823.1
0.158
si:ch211-242b18.1
-0.055
si:dkey-191j3.2
0.157
blvrb
-0.054
zgc:173486
0.146
rasgrf2b
-0.054
btbd16
0.142
CU467823.1
-0.053
cd7al
0.140
CR383676.1
-0.053
psmb8a
0.138
atp2b1b
-0.052
CR931813.1
0.138
uchl1
-0.052
LOC101885301
0.137
cdc25d
-0.052
clcn1a
0.135
vsig8a
-0.052
CU928131.1
0.132
nrxn1a
-0.052
LOC108179735
0.131
spag8
-0.051
wdr6
0.130
rnasekb
-0.051
cabz01076234.2
0.129
sprn2
-0.050
LOC108191590
0.127
nfe2l2a
-0.050
XLOC-004878
0.125
b3gat1b
-0.050
hoxb10a
0.123
htatip2
-0.050
hoxd13a
0.123
tescb
-0.050
taar19p
0.122
amd1
-0.050
znf975
0.120
ivns1abpa
-0.049
zgc:123217
0.119
tspan2a
-0.049
AL954694.1
0.118
atp6ap2
-0.049
si:ch211-234p6.9
0.117
calm1a
-0.049
CABZ01072245.1
0.115
olfm1b
-0.048
LOC103908936
0.115
badb
-0.048
elnb
0.113
fstl5
-0.048