Daniocell
tpcn1 (blastomeres)
two pore segment channel 1
ZFIN
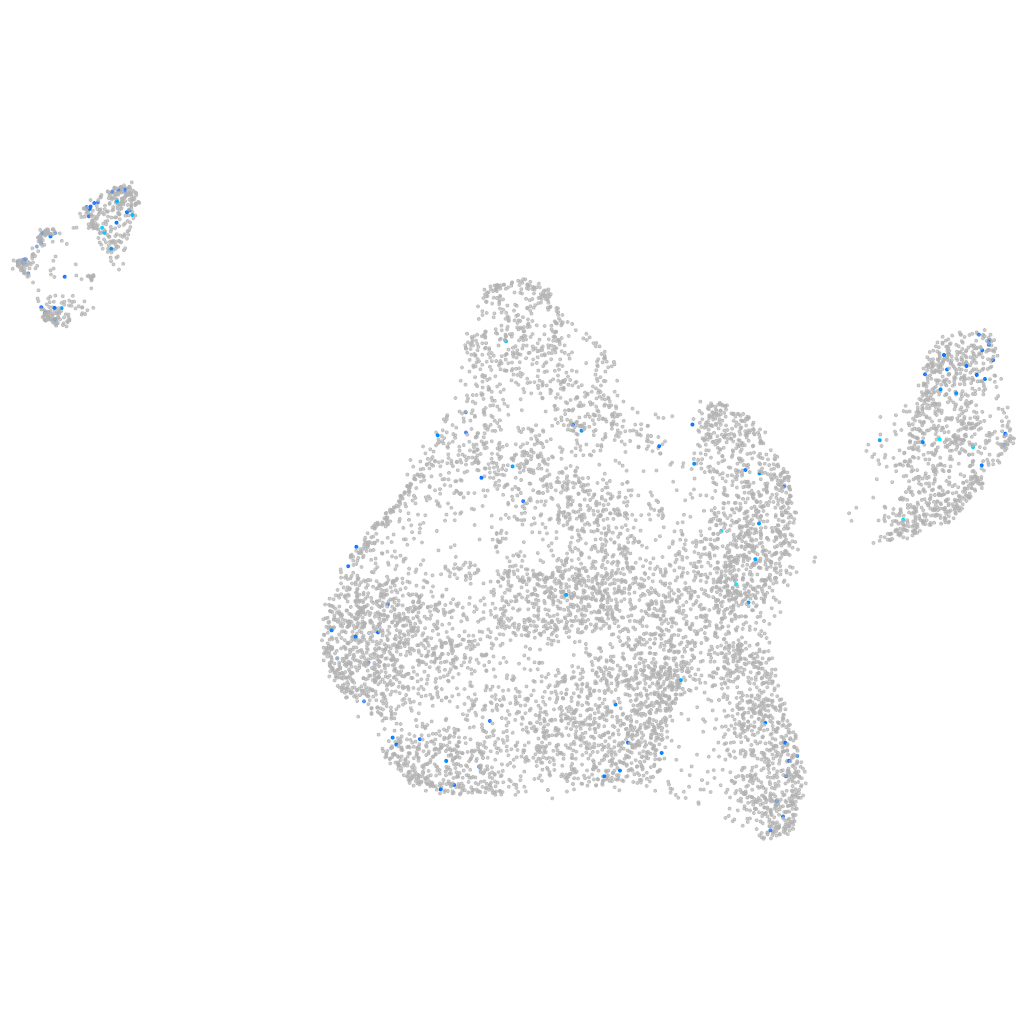
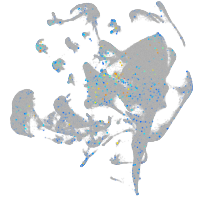
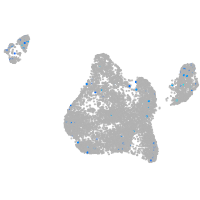
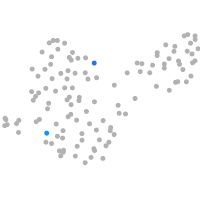
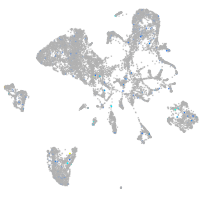
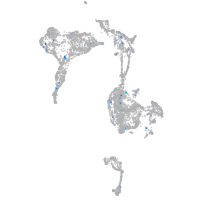
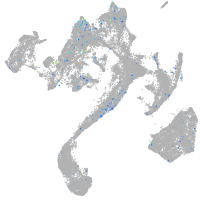
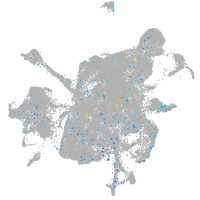
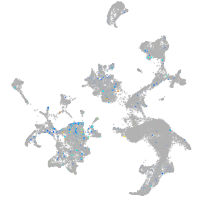
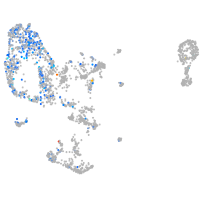
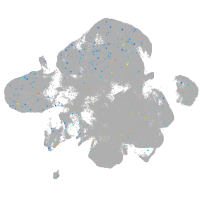
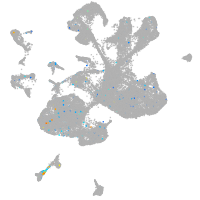
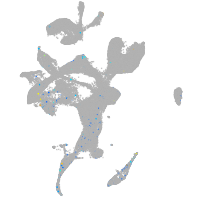
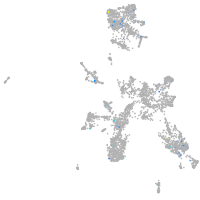
Gene expression UMAP
Display:
Expression
Stage
Other cell groups
all cells
blastomeres
PGCs
endoderm
axial mesoderm
muscle
mural cells /
non-skeletal muscle
mesenchyme
hematopoietic /
vasculature
pronephros
neural
spinal cord / glia
eye
taste / olfactory
otic / lateral line
epidermis
periderm
fin
ionocytes / mucous
pigment cells
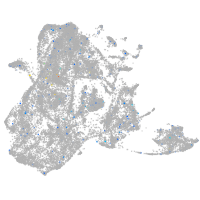
Expression by stage/cluster
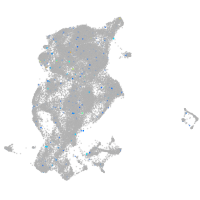
Correlated gene expression
Positive correlation
Negative correlation
Gene
r
Gene
r
CR855393.1
0.182
si:ch73-1a9.3
-0.102
oit3
0.168
marcksl1b
-0.100
cldn18
0.166
hspb1
-0.099
CR854827.2
0.157
eef1a1l1
-0.096
si:ch211-256e16.6
0.135
dynll1
-0.096
tgfbr2a
0.135
hmgn6
-0.095
pcdh7a
0.129
hnrnpa0b
-0.093
LOC103908820
0.125
hmgb2a
-0.093
CR812469.1
0.120
si:ch211-222l21.1
-0.089
si:ch73-367f21.5
0.118
stm
-0.088
zgc:113424
0.115
hmga1a
-0.087
slc47a1
0.115
aldob
-0.086
CABZ01044048.1
0.111
polr3gla
-0.082
pabpn1l
0.109
ybx1
-0.081
atg5
0.108
si:dkey-151g10.6
-0.080
grapa
0.106
si:ch211-152c2.3
-0.079
ska2
0.106
si:dkey-56m19.5
-0.077
mid1ip1l
0.106
pou5f3
-0.073
tmem192
0.104
rps7
-0.073
zgc:123217
0.104
cirbpb
-0.073
h2af1al
0.103
rps6
-0.072
FP067442.1
0.103
rpl35a
-0.072
ccdc50
0.103
atp1b1a
-0.069
hcn4
0.102
rplp1
-0.069
CU024870.2
0.102
rps4x
-0.068
fbxo45
0.102
ptmab
-0.068
si:ch1073-184j22.1
0.101
rps19
-0.067
olfml1
0.101
npm1a
-0.067
gramd1c
0.101
rps18
-0.067
XLOC-006258
0.101
rpl32
-0.067
acp5a
0.100
anp32b
-0.065
slc25a25a
0.099
khdrbs1a
-0.065
cth1
0.099
rps15a
-0.065
cldng
0.098
rpl36
-0.065
bmp15
0.097
CR383676.1
-0.065