Daniocell
tnnt1 (pronephros)
"troponin T type 1 (skeletal, slow)"
ZFIN
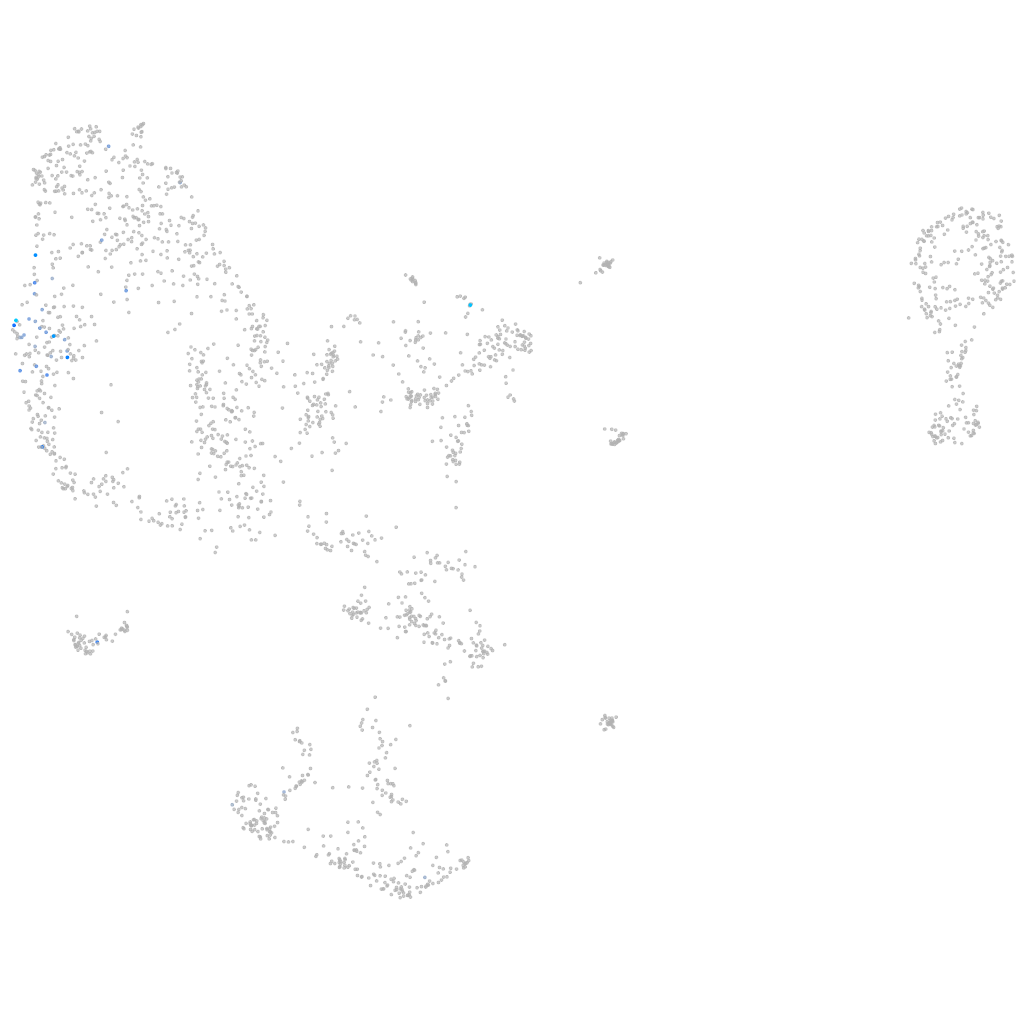
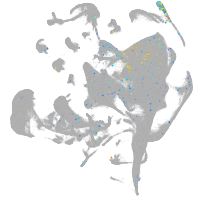
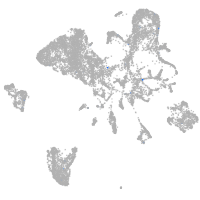
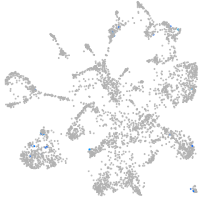
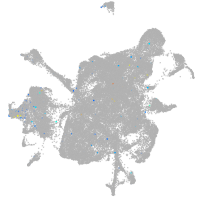
Gene expression UMAP
Display:
Expression
Stage
Other cell groups
all cells
blastomeres
PGCs
endoderm
axial mesoderm
muscle
mural cells /
non-skeletal muscle
mesenchyme
hematopoietic /
vasculature
pronephros
neural
spinal cord / glia
eye
taste / olfactory
otic / lateral line
epidermis
periderm
fin
ionocytes / mucous
pigment cells
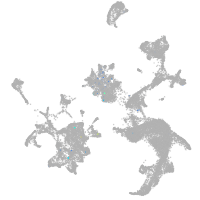
Expression by stage/cluster
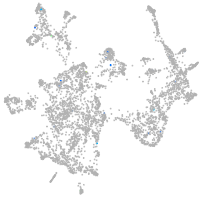
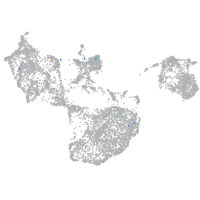
Correlated gene expression
Positive correlation
Negative correlation
Gene
r
Gene
r
cln6b
0.419
si:ch211-222l21.1
-0.139
prph2l
0.413
ptmab
-0.081
si:dkey-27n6.1.1
0.413
btg2
-0.072
neto1
0.408
h2afvb
-0.068
si:ch211-233h19.2
0.404
hmga1a
-0.068
AL831726.2
0.398
tubb2b
-0.067
gnrh3
0.396
hmgb2a
-0.067
gabrr3b
0.389
marcksl1b
-0.067
gsg1l2b
0.374
hmgb2b
-0.065
BX530034.1
0.370
setb
-0.064
abcc8b
0.355
h3f3d
-0.064
pcdh1gc6
0.354
hmgn2
-0.063
si:ch211-242f23.8
0.339
id3
-0.063
gabrr1
0.323
anp32b
-0.062
si:dkey-1d7.3
0.322
sub1a
-0.062
pcdh1g31
0.319
si:ch73-281n10.2
-0.062
grik1b
0.304
rhoaa
-0.062
gjd2b
0.301
cirbpa
-0.061
si:ch211-232m10.6
0.295
seta
-0.061
CABZ01070852.1
0.289
marcksb
-0.060
si:ch1073-83n3.2
0.287
ddx39ab
-0.060
BX901962.2
0.284
apex1
-0.060
muc13a
0.284
taf9
-0.059
baiap2b
0.278
stmn1a
-0.059
BX004774.2
0.274
ctnnb1
-0.058
kcnh4a
0.272
hmga2
-0.058
si:dkeyp-9d4.3
0.269
serbp1a
-0.057
slc6a18
0.265
sparc
-0.057
syt5a
0.264
pcna
-0.057
XLOC-020174
0.263
snrpd3l
-0.057
scpp1
0.252
hspb1
-0.057
gabrr3a
0.251
zmat2
-0.057
LOC103909376
0.247
snrpd1
-0.057
si:dkey-187a12.4
0.247
rps12
-0.056
slc24a3
0.246
txnipa
-0.056