Daniocell
tnfsf13b (pigment cells)
TNF superfamily member 13b
ZFIN
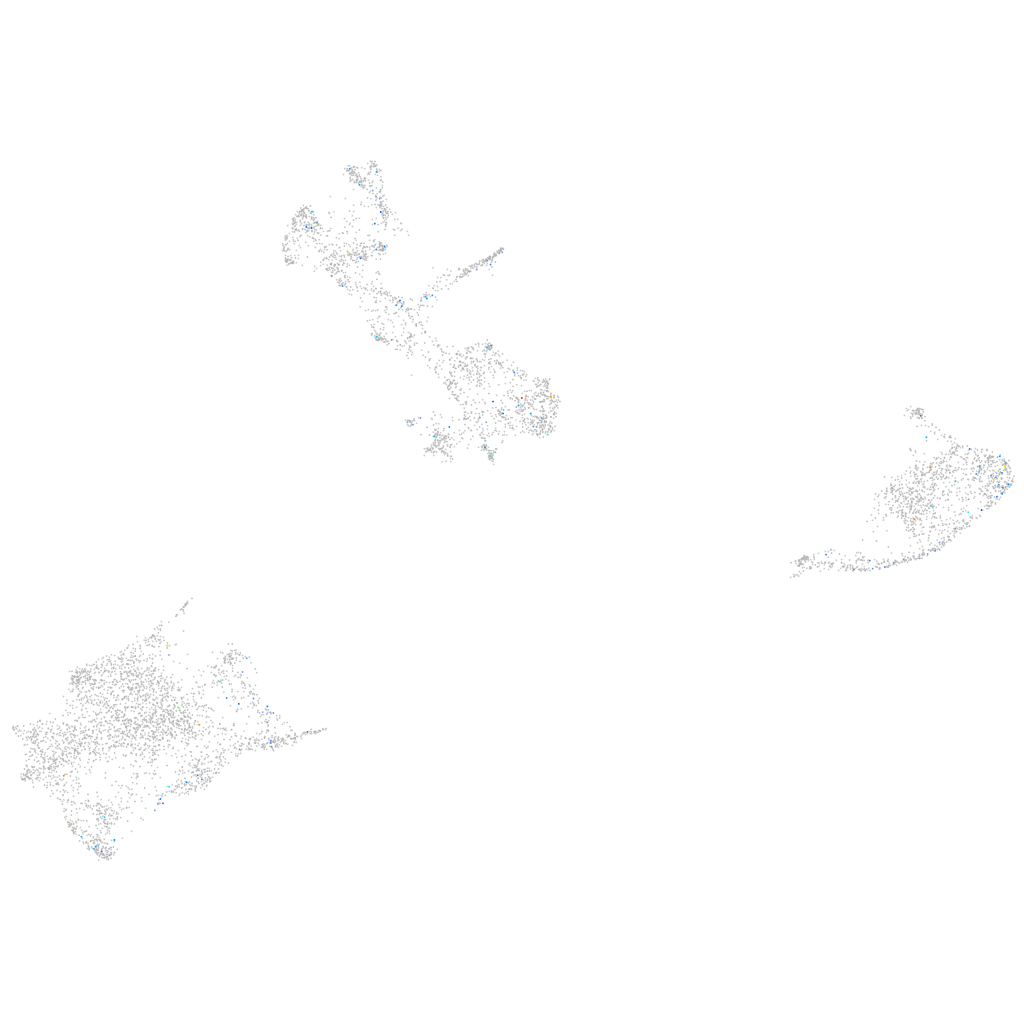
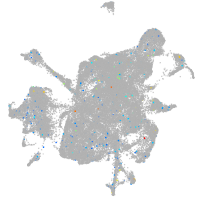
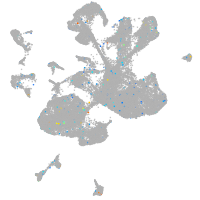
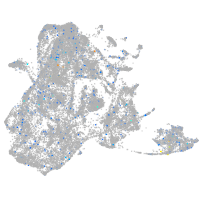
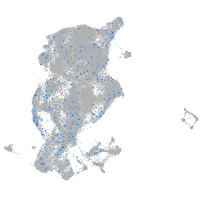
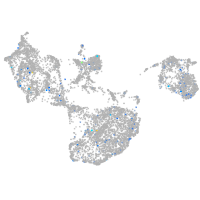
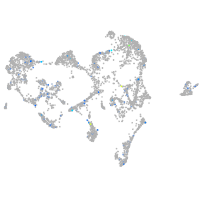
Gene expression UMAP
Display:
Expression
Stage
Other cell groups
all cells
blastomeres
PGCs
endoderm
axial mesoderm
muscle
mural cells /
non-skeletal muscle
mesenchyme
hematopoietic /
vasculature
pronephros
neural
spinal cord / glia
eye
taste / olfactory
otic / lateral line
epidermis
periderm
fin
ionocytes / mucous
pigment cells
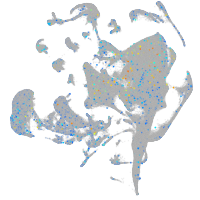
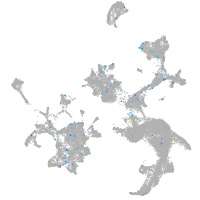
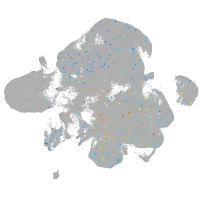
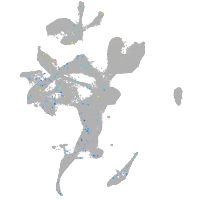
Expression by stage/cluster
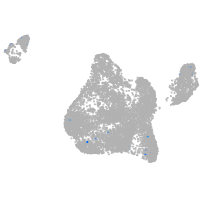
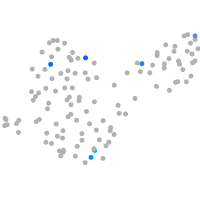
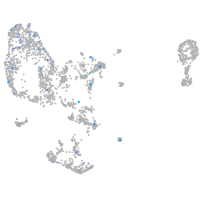
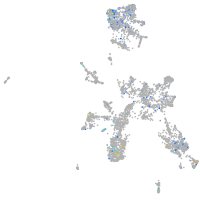
Correlated gene expression
Positive correlation
Negative correlation
Gene
r
Gene
r
LOC103910948
0.223
tpt1
-0.038
LOC108192080
0.207
rpl19
-0.037
BX927323.1
0.205
gch2
-0.033
GPR45
0.192
pts
-0.031
sema4ga
0.177
si:dkey-251i10.2
-0.029
XLOC-036242
0.173
acta1b
-0.028
XLOC-011861
0.172
CABZ01021592.1
-0.028
XLOC-036186
0.164
paics
-0.027
si:dkey-11e23.9
0.163
hbae3
-0.026
BX769173.1
0.163
akr1b1
-0.026
cfbl
0.159
rplp0
-0.025
LOC108183801
0.157
prdx1
-0.025
anpepa
0.156
aldob
-0.025
LOC110439855
0.153
rbp4l
-0.023
inpp4ab
0.149
marcksl1b
-0.022
XLOC-032159
0.140
mdh1aa
-0.022
caprin2
0.140
hbbe1.2
-0.021
grxcr1a.1
0.140
pvalb4
-0.021
tlx1
0.136
thy1
-0.020
trnC
0.133
hbbe1.3
-0.020
guca1e
0.133
gpd1b
-0.020
si:ch73-264p11.1
0.133
sult1st1
-0.020
FP016005.2
0.129
serp1
-0.020
gprc6a
0.127
hbae1.1
-0.019
CT990618.1
0.124
fbp1a
-0.019
LOC101884506
0.123
sar1b
-0.019
LOC103908875
0.118
myl1
-0.019
dhx32a
0.112
rab27b
-0.019
LOC110439393
0.110
actb1
-0.019
dcstamp
0.110
cyb5a
-0.019
LOC108191316
0.110
myhz1.2
-0.018
slc39a8
0.109
rps15a
-0.018
LOC101886083
0.109
gyg1b
-0.018
BX908386.1
0.107
hmga1a
-0.018
itga2.3
0.106
XLOC-001975
-0.018