Daniocell
tjap1 (periderm)
tight junction associated protein 1 (peripheral)
ZFIN
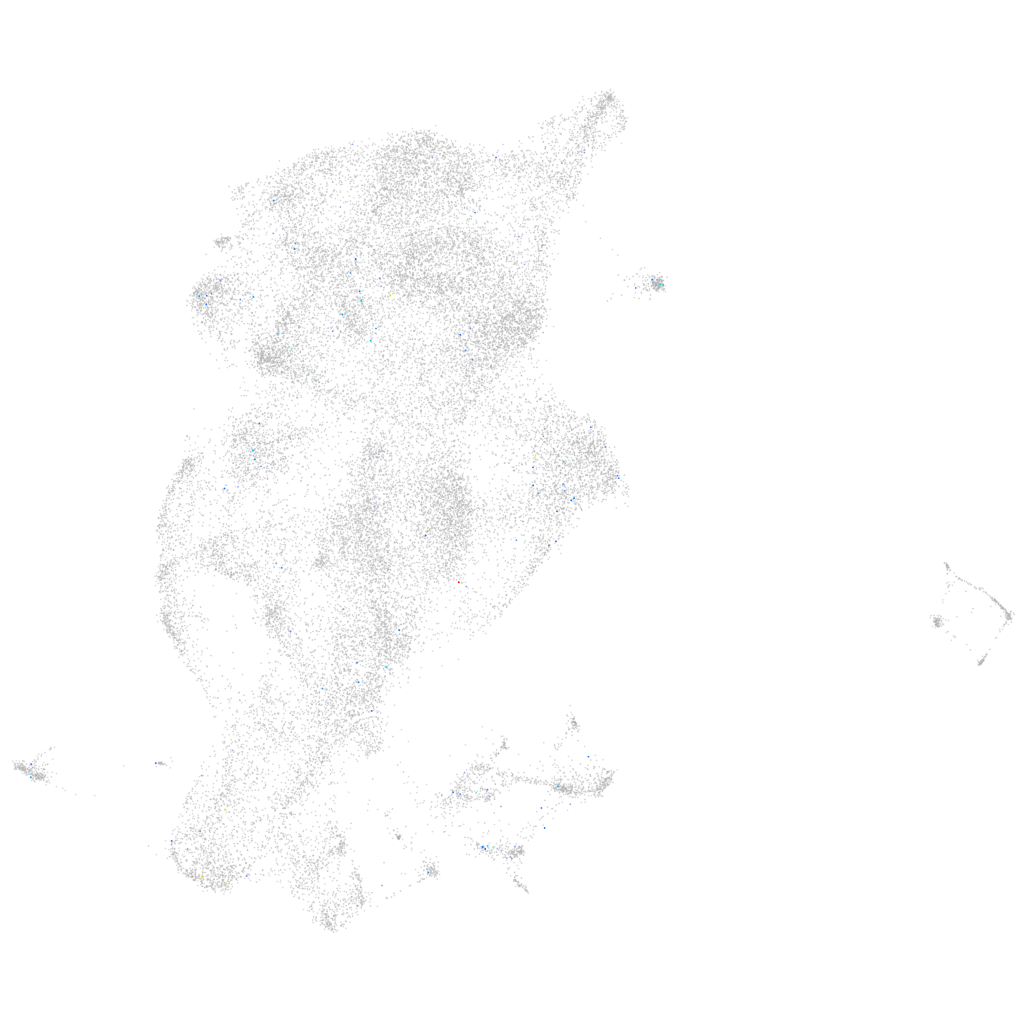
Gene expression UMAP
Display:
Expression
Stage
Other cell groups
all cells
blastomeres
PGCs
endoderm
axial mesoderm
muscle
mural cells /
non-skeletal muscle
mesenchyme
hematopoietic /
vasculature
pronephros
neural
spinal cord / glia
eye
taste / olfactory
otic / lateral line
epidermis
periderm
fin
ionocytes / mucous
pigment cells
Expression by stage/cluster
Correlated gene expression
Positive correlation
Negative correlation
Gene
r
Gene
r
LOC101884095
0.347
krt5
-0.030
fynb
0.217
cyt1
-0.028
LOC110439834
0.184
krt4
-0.026
OTOP1
0.135
rpl13
-0.026
XLOC-012358
0.134
mpc1
-0.025
CR855300.1
0.127
cyt1l
-0.025
CABZ01053976.1
0.125
cst14b.1
-0.025
pih1d2
0.124
rpl34
-0.024
LOC101885479.1
0.122
mgst1.2
-0.023
mtmr1b
0.122
agr1
-0.023
tbx4
0.119
si:ch211-157c3.4
-0.022
si:ch211-195b15.7
0.118
si:ch211-195b11.3
-0.022
nrl
0.116
mapre1a
-0.021
fgf3
0.112
tdh
-0.020
AL845419.1
0.110
gsta.1
-0.019
cyp19a1a
0.108
mtfp1
-0.019
rundc3aa
0.107
cfl1l
-0.019
si:dkey-261j4.4
0.106
bckdhb
-0.019
il21r.1
0.105
copz2
-0.018
si:ch211-80h18.1
0.102
anxa1a
-0.018
XRCC2
0.102
hmgb3b
-0.018
snx19a
0.101
ywhabl
-0.018
plek2
0.100
pof1b
-0.018
bmp1b
0.099
krtt1c19e
-0.018
otomp
0.095
fut9d
-0.017
adamtsl7
0.086
si:dkey-16p21.8
-0.017
CR392002.1
0.086
ube2d1b
-0.017
itga3b
0.086
CR854839.1
-0.017
LOC100333111
0.084
zgc:175088
-0.017
LO017784.1
0.080
krt17
-0.017
tubgcp4
0.079
arl6ip5b
-0.017
znf1055
0.078
si:ch211-105c13.3
-0.016
CR450814.1
0.077
ssr4
-0.016
znf1122
0.076
tuba8l2
-0.016
XLOC-003052
0.076
myh9a
-0.016