Daniocell
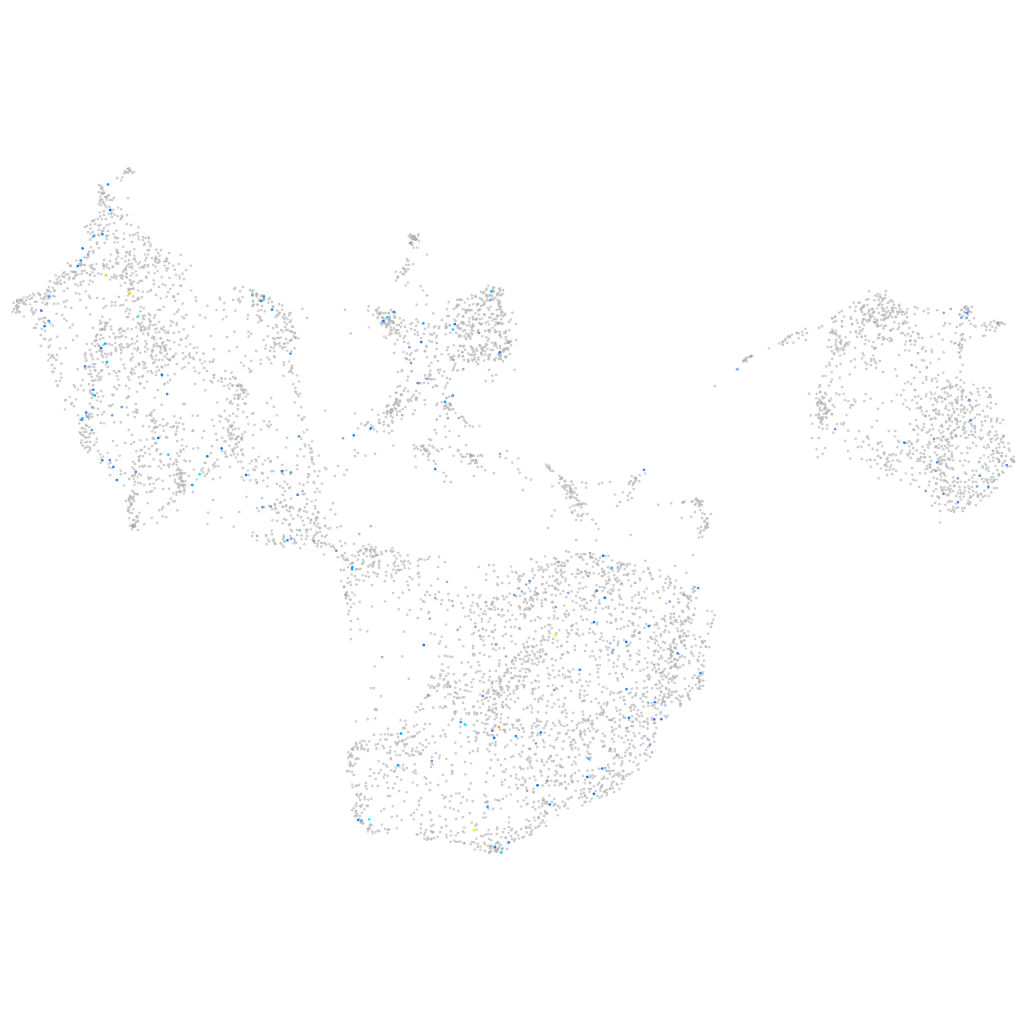
tjap1 (fin)
tight junction associated protein 1 (peripheral)
ZFIN
Gene expression UMAP
Display:
Expression
Stage
Other cell groups
all cells
blastomeres
PGCs
endoderm
axial mesoderm
muscle
mural cells /
non-skeletal muscle
mesenchyme
hematopoietic /
vasculature
pronephros
neural
spinal cord / glia
eye
taste / olfactory
otic / lateral line
epidermis
periderm
fin
ionocytes / mucous
pigment cells
Expression by stage/cluster
Correlated gene expression
Positive correlation
Negative correlation
Gene
r
Gene
r
si:dkey-238d18.5
0.181
eif4ebp3
-0.034
si:ch211-207e19.2
0.159
agr1
-0.033
BX248521.2
0.151
cyt1l
-0.031
LOC101885664
0.144
krt5
-0.031
LOC110438840
0.142
si:dkey-16p21.8
-0.031
LOC107195253
0.140
pkp3a
-0.030
LOC110439920
0.138
cxl34b.11
-0.030
vgll3
0.133
lgals3b
-0.030
CABZ01092907.1
0.128
si:dkey-183i3.5
-0.029
CABZ01063971.1
0.126
tcnbb
-0.029
P2RY14
0.119
cyp2y3
-0.029
wu:fi42e03
0.119
selenos
-0.029
XLOC-023481
0.116
mpzl2b
-0.028
si:dkey-20i20.4
0.113
abi3b
-0.028
mxg
0.112
krt91
-0.028
muc13b
0.110
zgc:194398
-0.028
XLOC-043043
0.109
mgarp
-0.027
CR847947.1
0.106
wu:fi04e12
-0.027
RF00092
0.106
hrc
-0.027
CABZ01118575.1
0.103
zgc:136930
-0.027
BX323793.1
0.103
si:dkey-33c14.3
-0.027
taar19o
0.102
nucks1b
-0.027
cyp2p8
0.102
XLOC-041945
-0.027
BX927078.1
0.102
krt8
-0.027
si:rp71-62i8.1
0.101
emilin1a
-0.026
BX927404.1
0.101
si:ch211-195b11.3
-0.026
foxb2
0.100
mcl1b
-0.026
nefmb
0.100
cav1
-0.026
sntg1
0.100
krt4
-0.025
LOC794117
0.097
thoc3
-0.025
mtcl1
0.097
eevs
-0.025
pcyt1bb
0.097
si:ch211-39i22.1
-0.025
si:dkey-208k22.6
0.096
tab1
-0.025
nsmfb
0.094
krit1
-0.025
LO018176.1
0.094
CABZ01048956.1
-0.025