Daniocell
tirap (glial cells / spinal cord)
toll-interleukin 1 receptor (TIR) domain containing adaptor protein
ZFIN
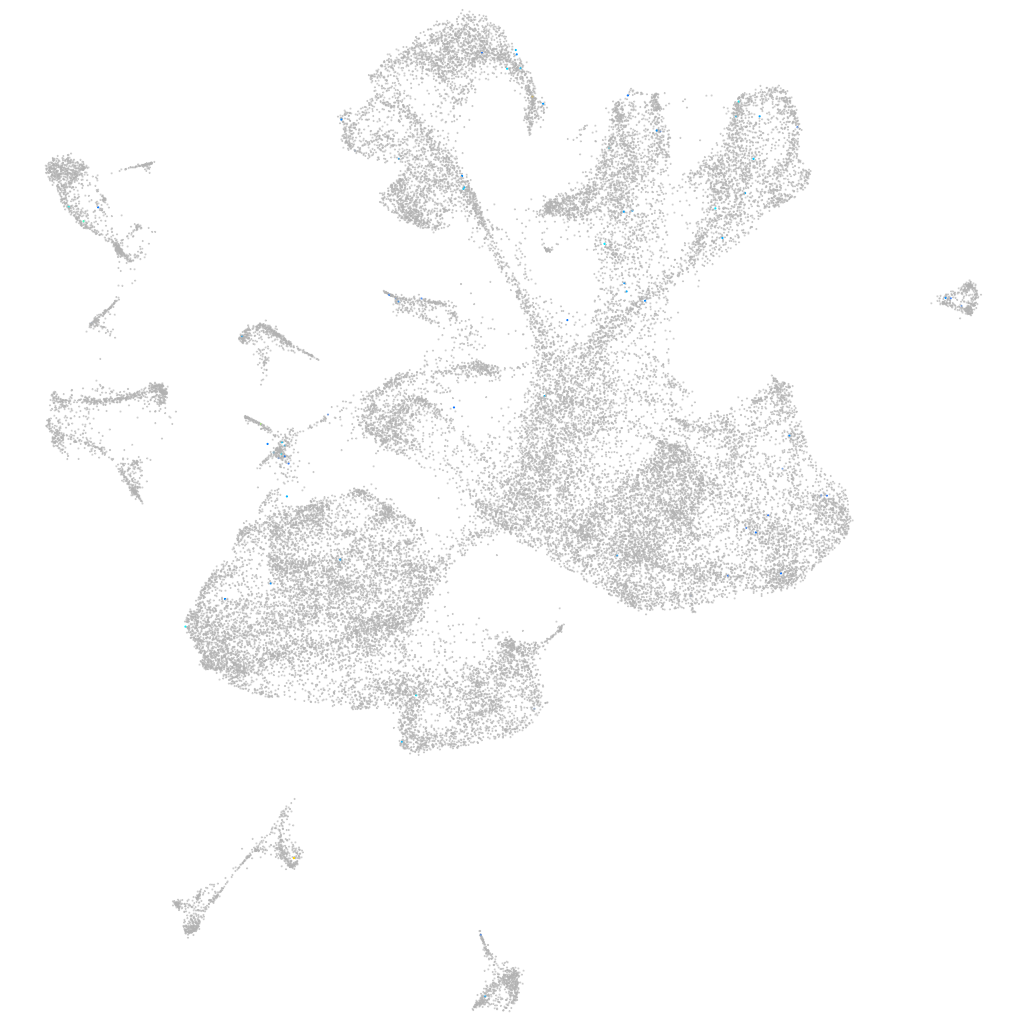
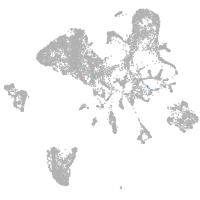
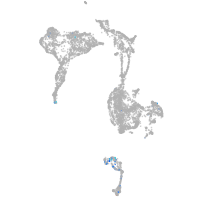
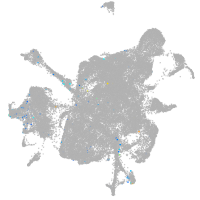
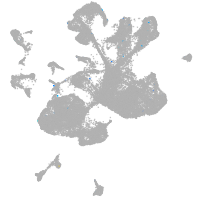
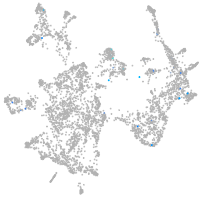
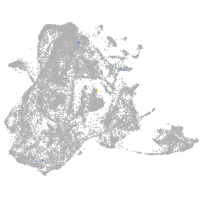
Gene expression UMAP
Display:
Expression
Stage
Other cell groups
all cells
blastomeres
PGCs
endoderm
axial mesoderm
muscle
mural cells /
non-skeletal muscle
mesenchyme
hematopoietic /
vasculature
pronephros
neural
spinal cord / glia
eye
taste / olfactory
otic / lateral line
epidermis
periderm
fin
ionocytes / mucous
pigment cells
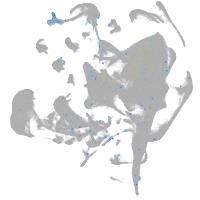
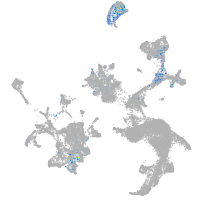
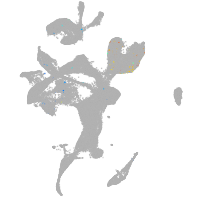
Expression by stage/cluster
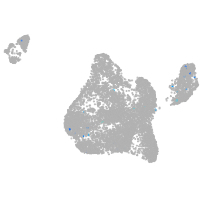
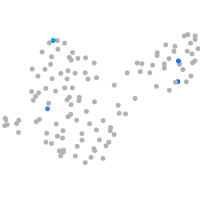
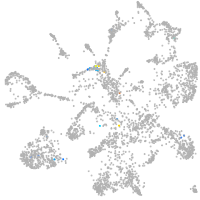
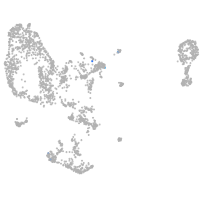
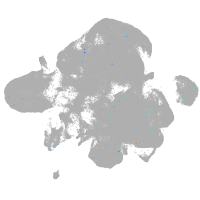
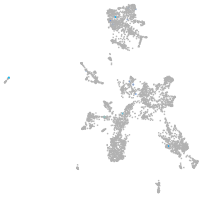
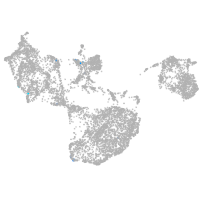
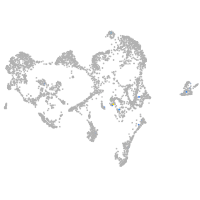
Correlated gene expression
Positive correlation
Negative correlation
Gene
r
Gene
r
LOC100150033
0.132
cldn5a
-0.023
XLOC-031680
0.105
id1
-0.019
si:ch211-106n13.3
0.100
notch1b
-0.018
XLOC-015286
0.098
mdka
-0.018
si:ch211-196c10.13
0.091
cd81a
-0.017
LOC101886371
0.089
her15.1
-0.017
cd247l
0.085
XLOC-003690
-0.016
FO704635.1
0.078
gas1b
-0.016
XLOC-019042
0.071
cd82a
-0.016
vav3a
0.071
boc
-0.016
LOC103910162
0.066
si:ch73-21g5.7
-0.016
si:busm1-194e12.8
0.064
XLOC-003689
-0.015
unc13c
0.063
btg2
-0.015
LOC101884177
0.061
her2
-0.015
si:dkey-10h3.2
0.059
plp1a
-0.015
si:dkey-121h17.7
0.056
notch3
-0.014
cldn10a
0.056
slc1a3a
-0.014
CU655829.1
0.055
lfng
-0.014
gnb3a
0.055
si:ch211-237c6.4
-0.014
vsx1
0.054
sox19a
-0.014
crx
0.053
sb:cb81
-0.014
grik1b
0.053
si:dkey-6n21.12
-0.014
si:ch1073-83n3.2
0.051
si:ch211-212k18.5
-0.013
slc28a1
0.049
cdca7b
-0.013
CT573139.2
0.049
sox3
-0.013
CU929199.1
0.048
zgc:55461
-0.013
NC-002333.8
0.048
tgif1
-0.013
ptger2a
0.048
ntn1a
-0.013
commd10
0.046
sort1a
-0.013
rs1a
0.045
mir219-3
-0.013
fam166b
0.045
dusp1
-0.013
CU928046.1
0.044
pcdh1g32
-0.013
abcb4
0.044
jam3b
-0.012
CABZ01088367.1
0.044
gfap
-0.012
si:dkey-102g19.3
0.043
her12
-0.012