Daniocell
ticam1 (glial cells / spinal cord)
toll-like receptor adaptor molecule 1
ZFIN
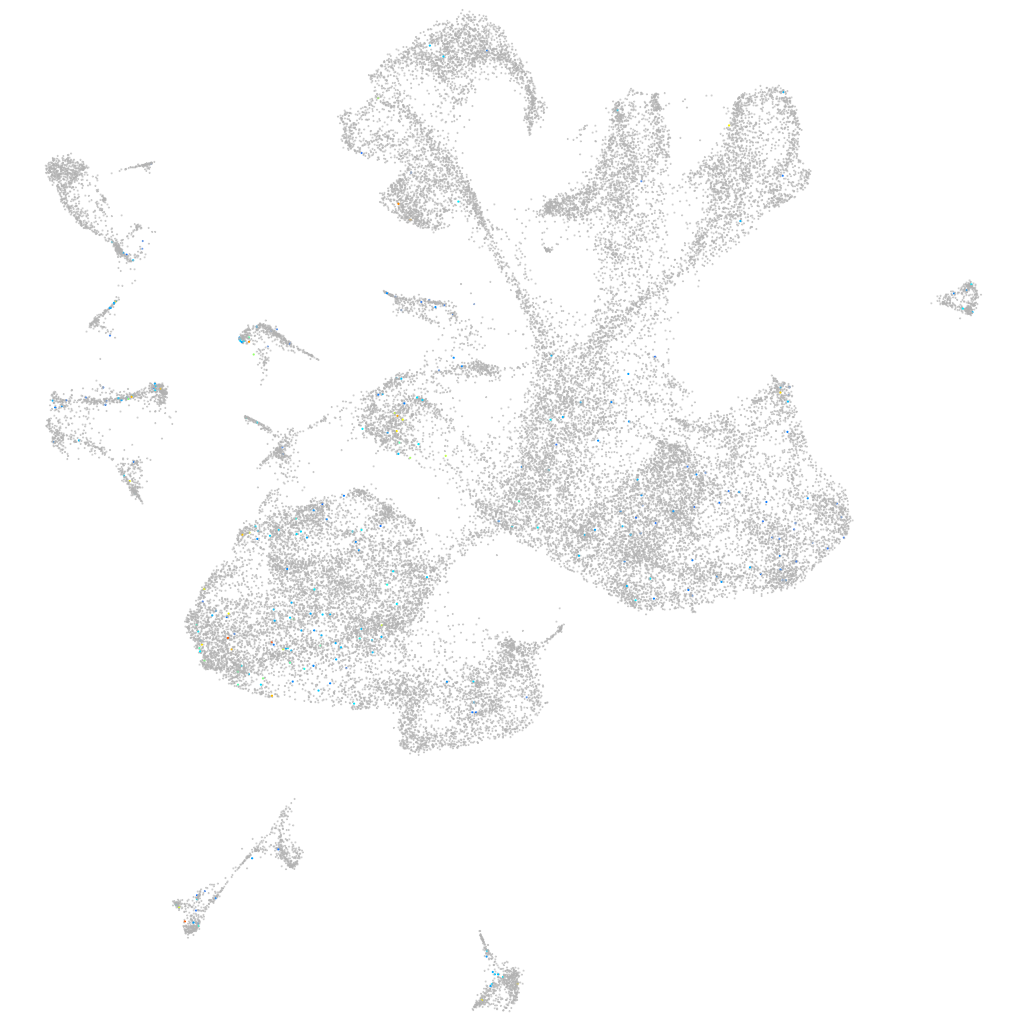
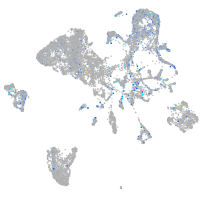
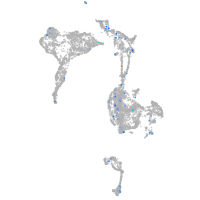
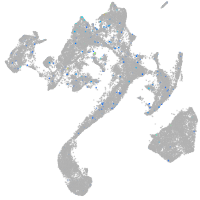
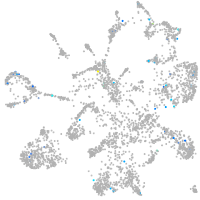
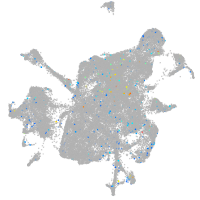
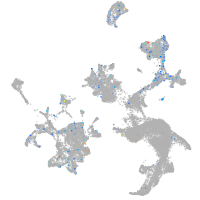
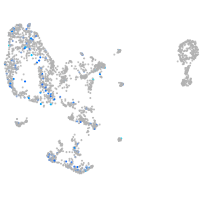
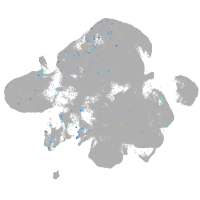
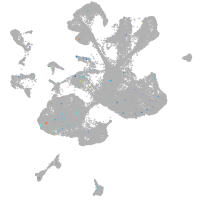
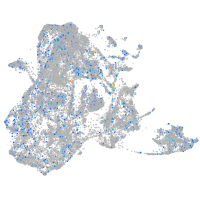
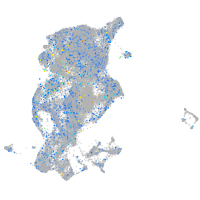
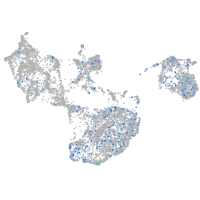
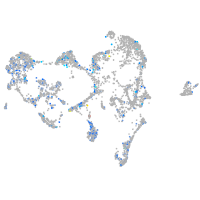
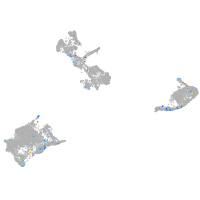
Gene expression UMAP
Display:
Expression
Stage
Other cell groups
all cells
blastomeres
PGCs
endoderm
axial mesoderm
muscle
mural cells /
non-skeletal muscle
mesenchyme
hematopoietic /
vasculature
pronephros
neural
spinal cord / glia
eye
taste / olfactory
otic / lateral line
epidermis
periderm
fin
ionocytes / mucous
pigment cells
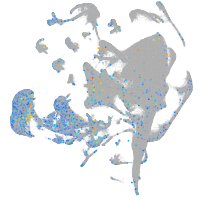
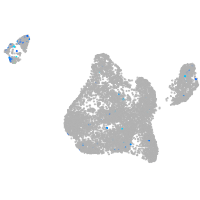
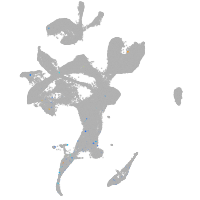
Expression by stage/cluster
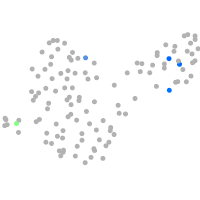
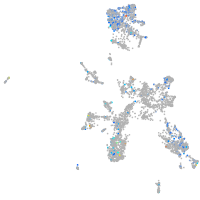
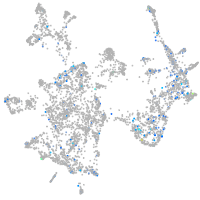
Correlated gene expression
Positive correlation
Negative correlation
Gene
r
Gene
r
LOC110439495
0.106
ptmab
-0.054
gpr35.1
0.077
h3f3d
-0.043
si:dkey-19a16.16
0.072
si:ch211-222l21.1
-0.042
LOC110438990
0.069
hmgn2
-0.041
acana
0.068
hnrnpa0l
-0.041
LOC110438024
0.068
hmga1a
-0.041
XLOC-022888
0.064
khdrbs1a
-0.041
BX950225.1
0.064
myt1b
-0.040
fancm
0.063
cirbpb
-0.040
CU651662.1
0.061
tubb2b
-0.039
slc3a2a
0.061
hsp90ab1
-0.039
znf1093
0.060
h2afvb
-0.039
si:ch211-66e2.5
0.059
elavl3
-0.037
LOC110438839
0.059
hmgb2b
-0.037
hepacama
0.059
marcksb
-0.036
CR456635.1
0.059
si:ch73-1a9.3
-0.036
SLC18A1
0.059
hnrnpa0b
-0.036
cyp2ad3
0.058
si:ch211-288g17.3
-0.035
tgfa
0.057
hmgb3a
-0.034
zgc:92137
0.056
fabp3
-0.034
itgb1b.1
0.056
sox11b
-0.033
apoa4a
0.056
ilf2
-0.033
fxyd1
0.056
rps21
-0.033
styk1a
0.056
h3f3a
-0.032
BX248113.1
0.055
nono
-0.031
mob1bb
0.054
epb41a
-0.031
GPR62 (1 of many)
0.054
tubb5
-0.031
npc2
0.053
si:ch211-57n23.4
-0.031
anxa13
0.053
hmgb1b
-0.031
nlrc7
0.053
cirbpa
-0.030
thbs1b
0.053
rpl36a
-0.030
ptn
0.053
si:ch73-386h18.1
-0.030
cx43
0.053
rps25
-0.030
GCA
0.052
nucks1a
-0.030
BX569790.1
0.052
hnrnpaba
-0.030