Daniocell
tcerg1a (ionocytes / mucous-producing)
transcription elongation regulator 1a (CA150)
ZFIN
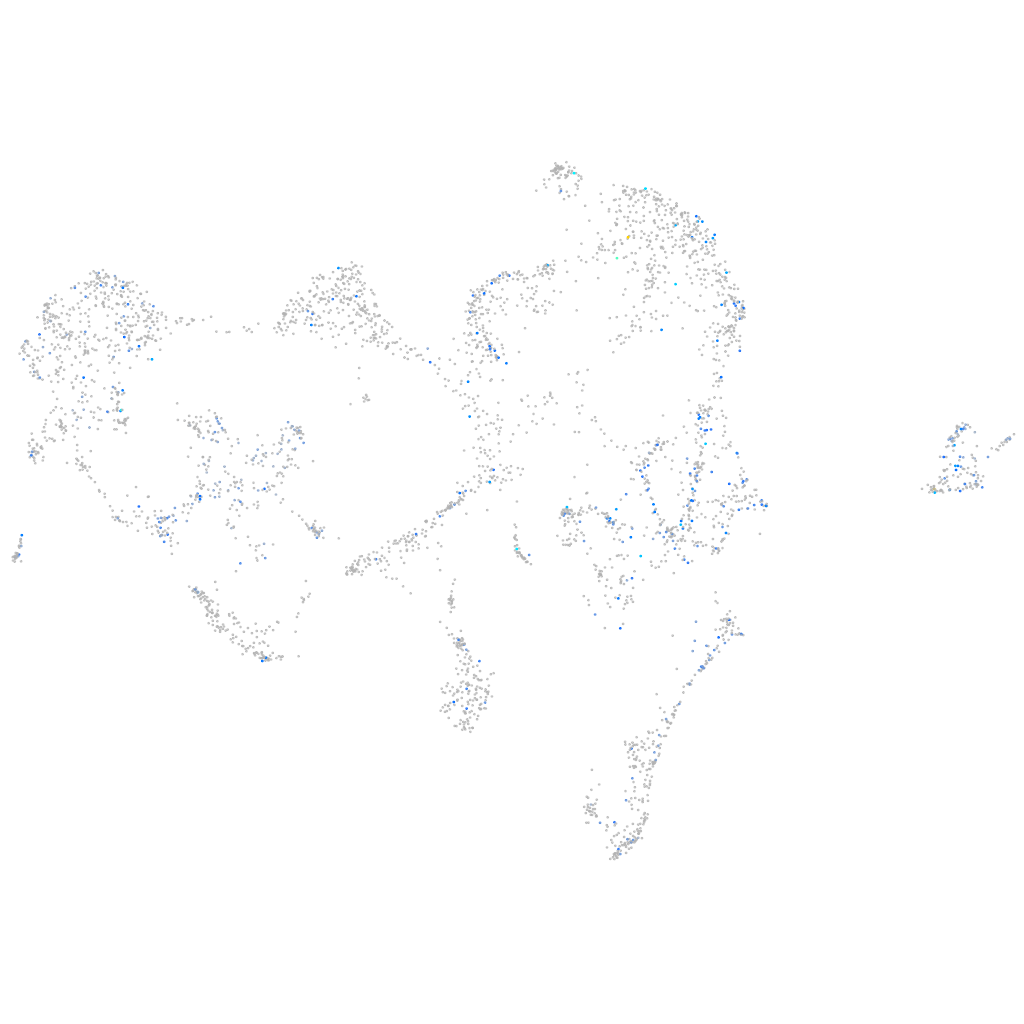
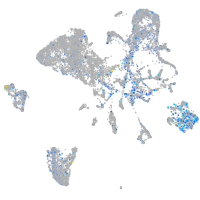
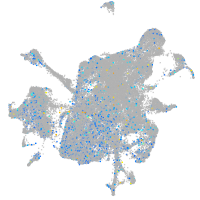
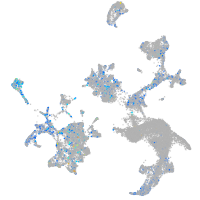
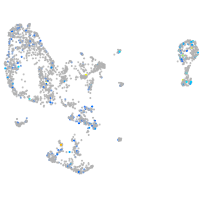
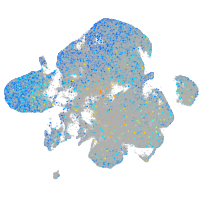
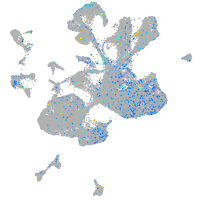
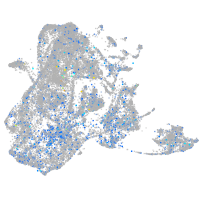
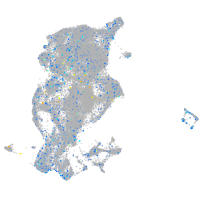
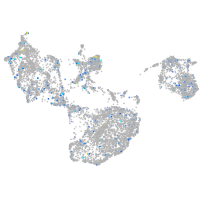
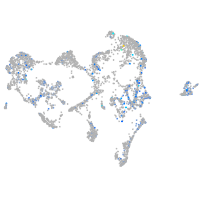
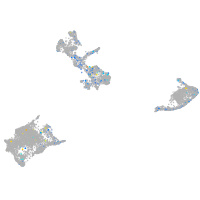
Gene expression UMAP
Display:
Expression
Stage
Other cell groups
all cells
blastomeres
PGCs
endoderm
axial mesoderm
muscle
mural cells /
non-skeletal muscle
mesenchyme
hematopoietic /
vasculature
pronephros
neural
spinal cord / glia
eye
taste / olfactory
otic / lateral line
epidermis
periderm
fin
ionocytes / mucous
pigment cells
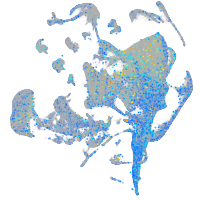
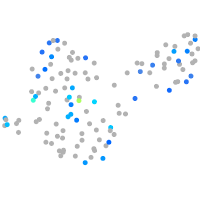
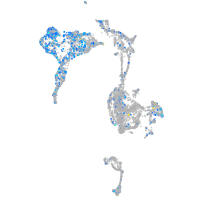
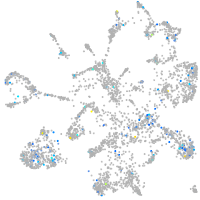
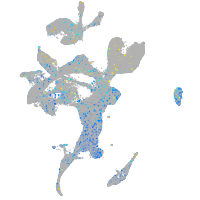
Expression by stage/cluster
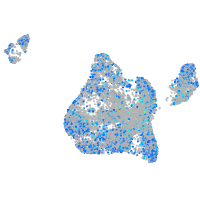
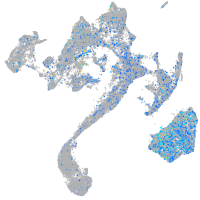
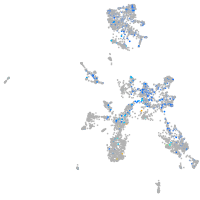
Correlated gene expression
Positive correlation
Negative correlation
Gene
r
Gene
r
XLOC-032793
0.209
si:dkey-193p11.2
-0.069
LOC110438262
0.181
soul2
-0.068
CABZ01111555.1
0.163
si:dkey-248g15.3
-0.067
cdx1a
0.150
si:ch211-195b11.3
-0.067
h3f3a
0.149
selenow1
-0.067
esr2a
0.147
s100v2
-0.065
lbr
0.147
sgk2a
-0.065
nav1b
0.145
LOC799574
-0.062
tubb2b
0.141
atp5if1b
-0.061
kif13a
0.140
cst14b.1
-0.060
hmgb2b
0.140
ftr83
-0.059
kif18a
0.140
atp1b1b
-0.058
stac3
0.138
romo1
-0.058
nlgn1
0.138
icn
-0.057
cenpf
0.136
crp3
-0.057
cited4b
0.133
ethe1
-0.056
rgs9b
0.132
zgc:193505
-0.056
si:ch211-121j5.4
0.128
selenow2b
-0.056
zgc:114119
0.128
rgs5b
-0.055
seta
0.128
si:ch73-31d8.2
-0.055
anp32a
0.127
si:dkey-33i11.4
-0.055
dut
0.127
BX000438.2
-0.054
mki67
0.126
si:dkey-184p9.7
-0.054
XLOC-019908
0.123
gstp1
-0.054
cbx3a
0.122
atp6v1h
-0.053
id1
0.122
icn2
-0.053
ccdc166
0.121
nqo1
-0.053
hnrnpabb
0.121
rnf128a
-0.052
si:dkeyp-75h12.7
0.120
wu:fb18f06
-0.052
agap3
0.120
atp5l
-0.052
hps5
0.120
ndrg1a
-0.052
atad5a
0.119
tspan35
-0.051
ncapg
0.119
krt4
-0.051
cx43.4
0.119
mpc2
-0.051
si:ch211-222l21.1
0.118
si:dkey-189h5.6
-0.050