Daniocell
tcea3 (blastomeres)
"transcription elongation factor A (SII), 3"
ZFIN
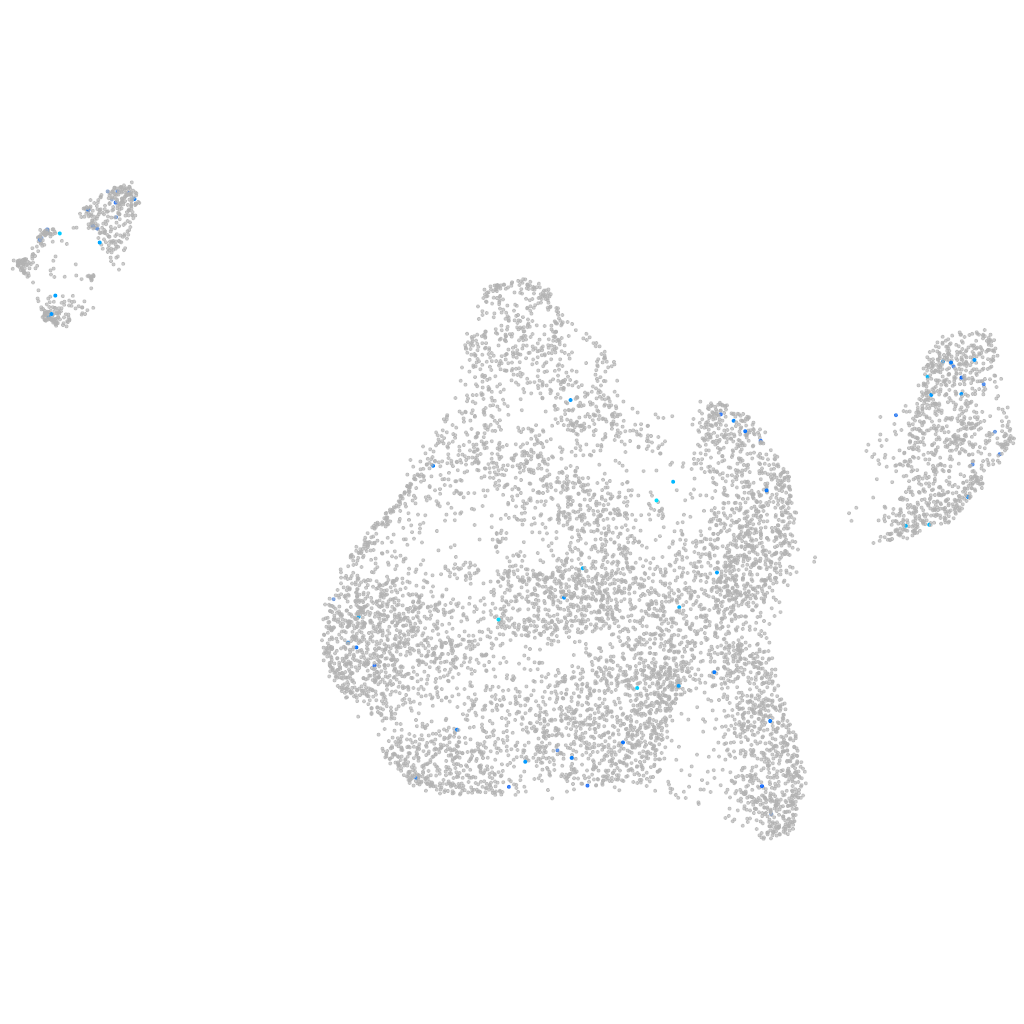
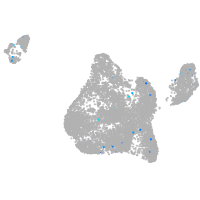
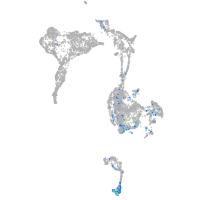
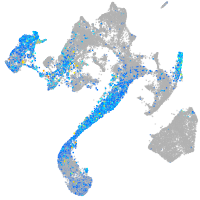
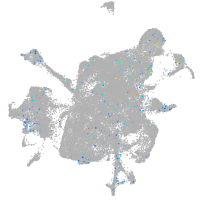
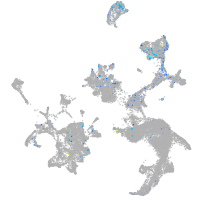
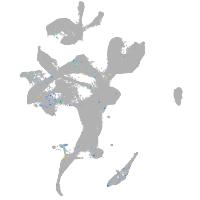
Gene expression UMAP
Display:
Expression
Stage
Other cell groups
all cells
blastomeres
PGCs
endoderm
axial mesoderm
muscle
mural cells /
non-skeletal muscle
mesenchyme
hematopoietic /
vasculature
pronephros
neural
spinal cord / glia
eye
taste / olfactory
otic / lateral line
epidermis
periderm
fin
ionocytes / mucous
pigment cells
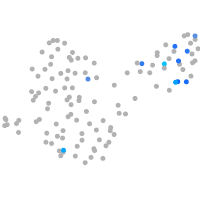
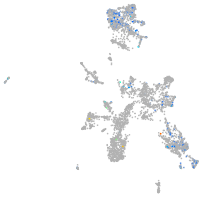
Expression by stage/cluster
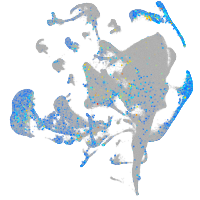
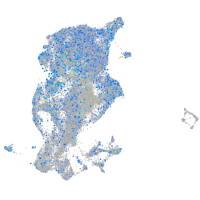
Correlated gene expression
Positive correlation
Negative correlation
Gene
r
Gene
r
si:ch73-281i18.4
0.194
rps20
-0.076
hrh1
0.170
hmga1a
-0.071
LO018605.2
0.157
rps15
-0.069
slc7a7
0.154
marcksl1b
-0.067
ifng1
0.152
eef1a1l1
-0.067
CABZ01075572.1
0.144
si:ch73-1a9.3
-0.064
si:dkey-38n4.2
0.142
si:ch211-152c2.3
-0.062
FP016005.1
0.142
dynll1
-0.060
c6ast4
0.142
si:dkey-151g10.6
-0.058
ppa1a
0.141
rpl36a
-0.057
diras1b
0.138
si:ch211-222l21.1
-0.057
jpt1a
0.127
rps15a
-0.057
LOC100535588
0.123
polr3gla
-0.057
LOC103909138
0.121
rps25
-0.056
BX511021.3
0.118
hspb1
-0.056
prf1.9
0.113
stm
-0.054
ttc29
0.113
rplp1
-0.054
BX005484.1
0.110
rpl7a
-0.053
pimr83
0.110
hmgn6
-0.053
LOC110438269
0.104
hmgb2a
-0.053
LOC101885675
0.104
hnrnpa0b
-0.052
pgr
0.102
rps6
-0.051
CABZ01058362.1
0.100
rps12
-0.050
zic6
0.100
aldob
-0.050
si:dkey-56f14.7
0.099
rpsa
-0.050
chrnb4
0.098
rpl26
-0.050
itgb2
0.097
rpl39
-0.049
si:dkey-264b2.3
0.095
rpl32
-0.049
LOC103911063
0.094
rps3a
-0.049
AL953866.1
0.091
rps19
-0.048
MSANTD2
0.090
rps24
-0.048
anks1b
0.090
apoeb
-0.048
CABZ01046087.1
0.090
rps21
-0.047
LOC101884894
0.090
rpl35a
-0.047
vwa3a
0.088
rpl29
-0.046