Daniocell
tbl1x (pronephros)
transducin beta like 1 X-linked
ZFIN
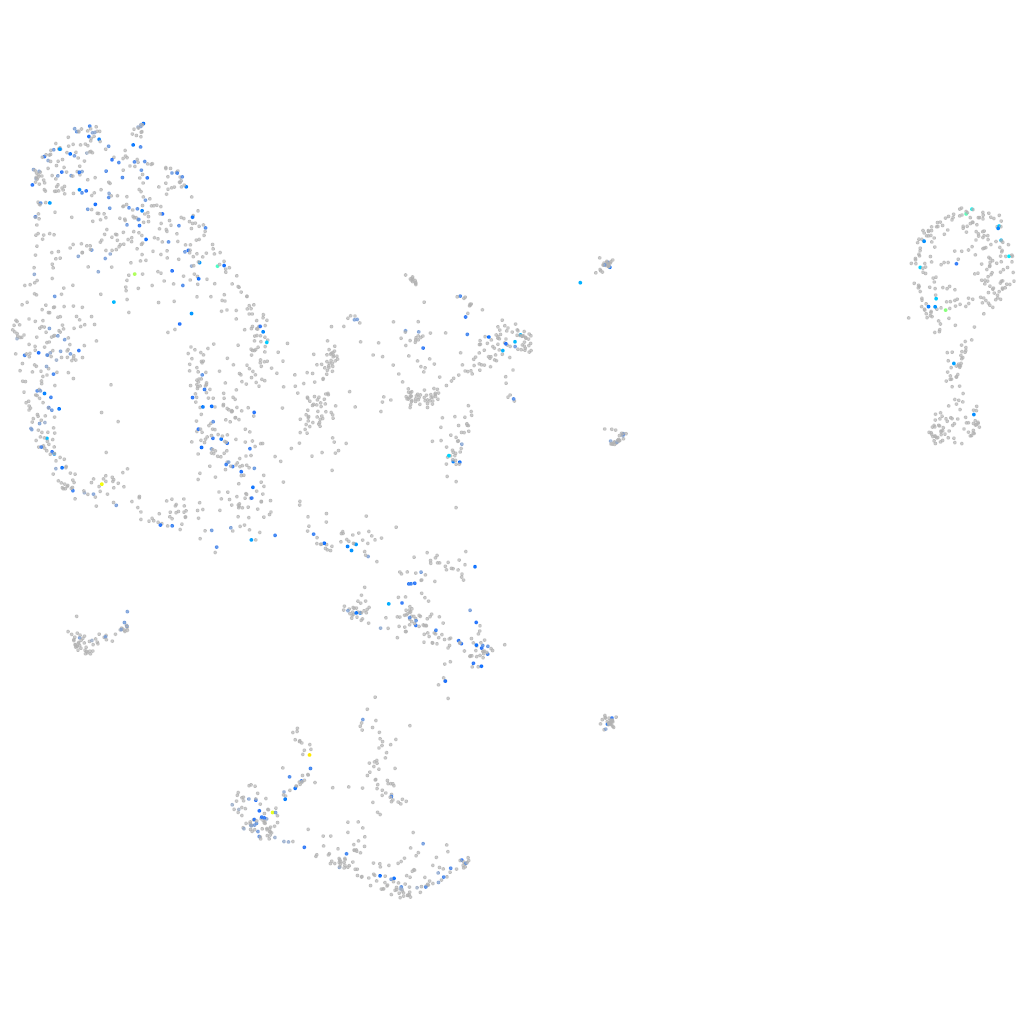
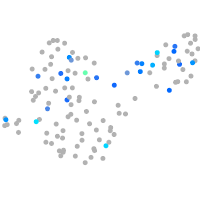
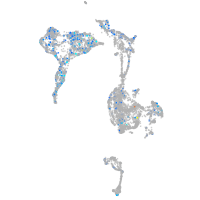
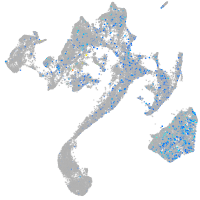
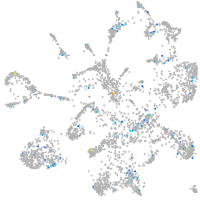
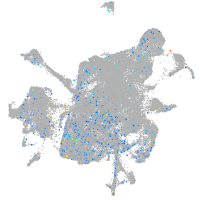
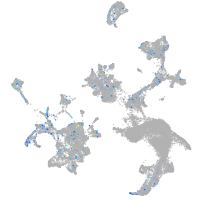
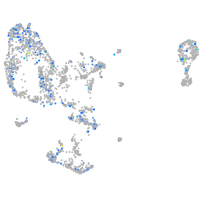
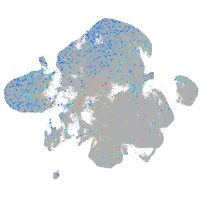
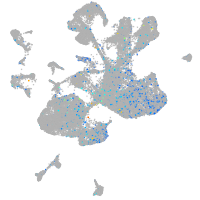
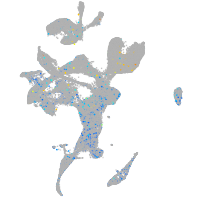
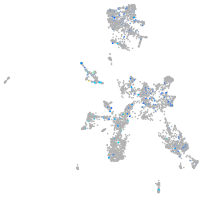
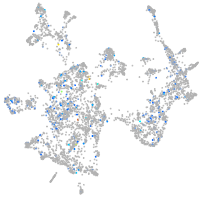
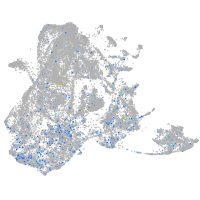
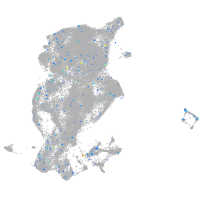
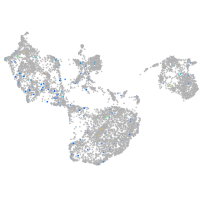
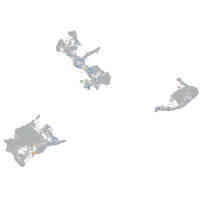
Gene expression UMAP
Display:
Expression
Stage
Other cell groups
all cells
blastomeres
PGCs
endoderm
axial mesoderm
muscle
mural cells /
non-skeletal muscle
mesenchyme
hematopoietic /
vasculature
pronephros
neural
spinal cord / glia
eye
taste / olfactory
otic / lateral line
epidermis
periderm
fin
ionocytes / mucous
pigment cells
Expression by stage/cluster
Correlated gene expression
Positive correlation
Negative correlation
Gene
r
Gene
r
XLOC-033024
0.188
cyt1
-0.061
nos2b
0.182
tmsb1
-0.059
LOC108184022
0.180
etv2
-0.057
ccl27a
0.175
coil
-0.056
si:dkey-21e13.3
0.169
icn
-0.056
si:dkey-279j5.1
0.169
thoc6
-0.055
si:ch73-138e16.3
0.168
tal1
-0.054
si:ch73-344o19.1
0.166
knop1
-0.051
il13
0.162
ddx51
-0.050
sod3b
0.160
si:dkey-36i7.3
-0.050
XLOC-022666
0.152
hoxa9a
-0.049
XLOC-040812
0.149
hbbe1.1
-0.049
LOC110439365
0.147
apip
-0.049
RF00066
0.146
krt4
-0.048
si:dkeyp-114g9.1
0.146
s100v1
-0.048
LOC108182930
0.140
CABZ01063556.1
-0.048
LOC101882114
0.137
zgc:193505
-0.048
cyp2aa3
0.136
ubtf
-0.047
si:dkey-25i10.1
0.135
gabpa
-0.047
txndc5
0.135
mid1ip1a
-0.046
ARHGAP22
0.131
wdr46
-0.046
BX005389.4
0.130
drl
-0.046
BX324188.1
0.130
rpl21
-0.046
LOC103910418
0.129
krtt1c19e
-0.046
glceb
0.127
rfc5
-0.046
cyp2aa2
0.127
nufip1
-0.045
irf10
0.126
slc25a18
-0.045
LOC108190117
0.125
noc2l
-0.045
GPR139
0.125
atp1a1a.3
-0.044
tbc1d4
0.125
nsrp1
-0.044
LOC101884161
0.124
atf7ip2
-0.044
CABZ01079192.1
0.124
pik3r3b
-0.044
trnH
0.124
atxn3
-0.044
CABZ01066578.1
0.121
slc12a3
-0.043
LOC100334666
0.120
kif1aa
-0.043