Daniocell
tbc1d15 (blastomeres)
"TBC1 domain family, member 15"
ZFIN
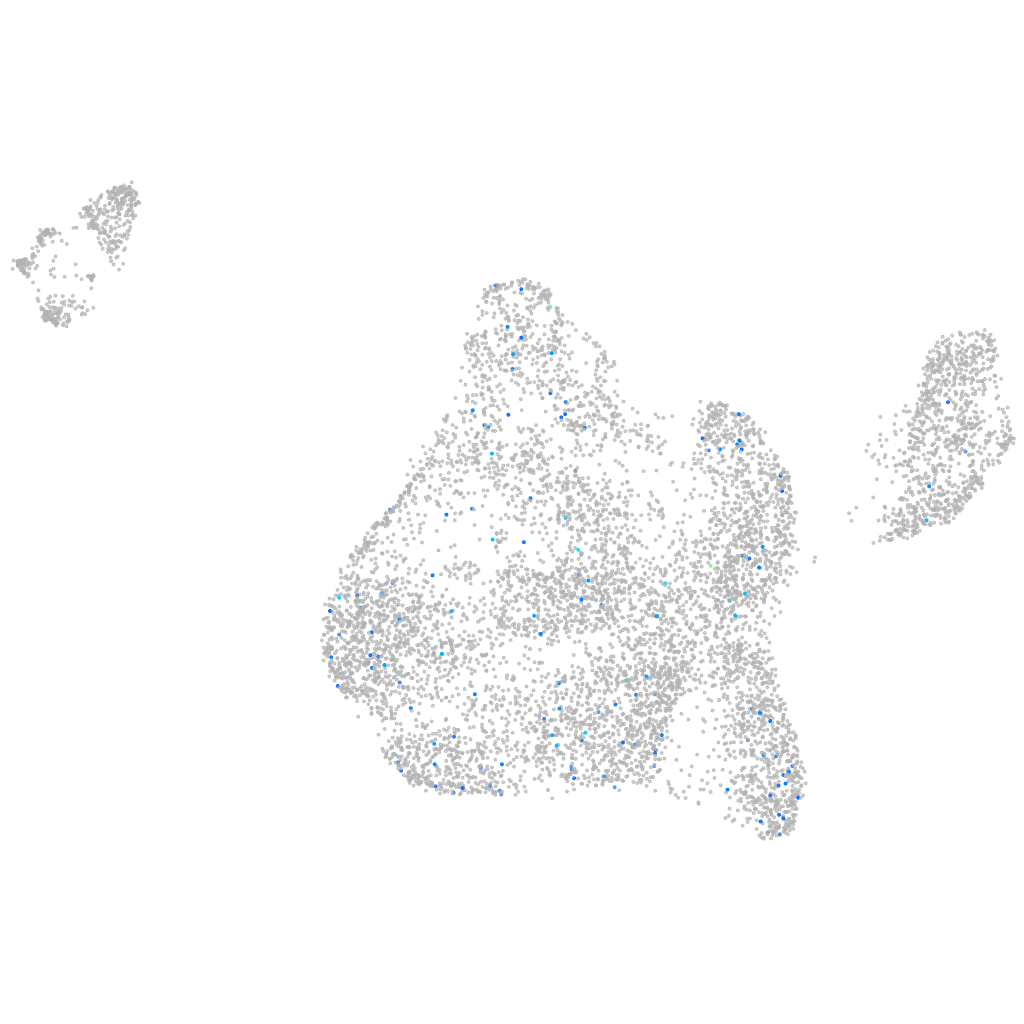
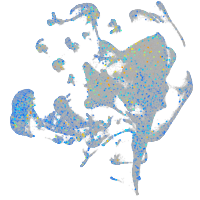
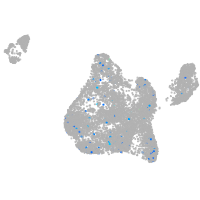
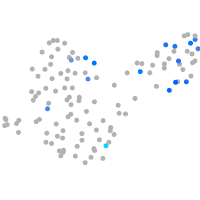
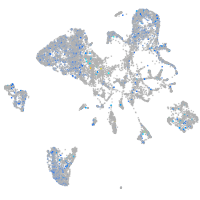
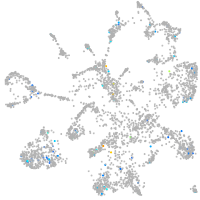
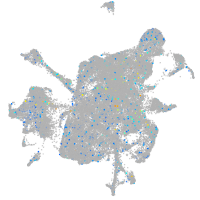
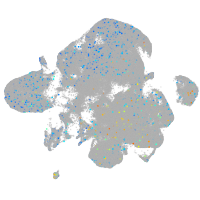
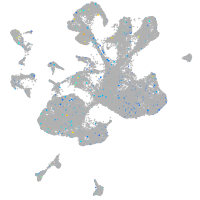
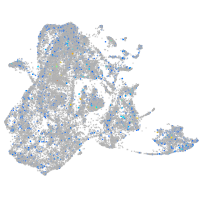
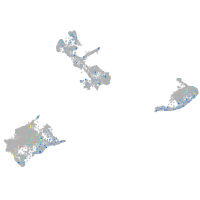
Gene expression UMAP
Display:
Expression
Stage
Other cell groups
all cells
blastomeres
PGCs
endoderm
axial mesoderm
muscle
mural cells /
non-skeletal muscle
mesenchyme
hematopoietic /
vasculature
pronephros
neural
spinal cord / glia
eye
taste / olfactory
otic / lateral line
epidermis
periderm
fin
ionocytes / mucous
pigment cells
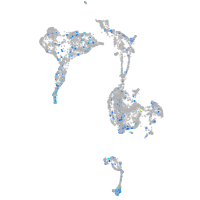
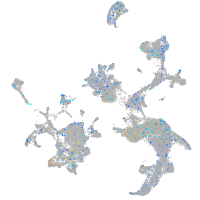
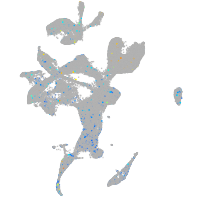
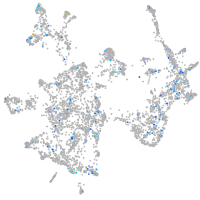
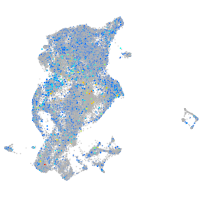
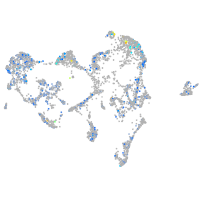
Expression by stage/cluster
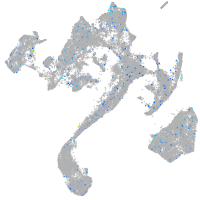
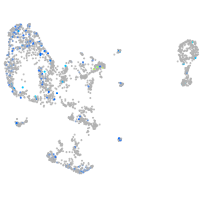
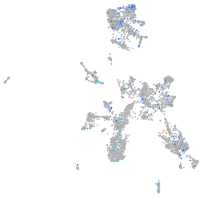
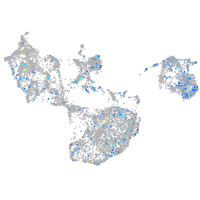
Correlated gene expression
Positive correlation
Negative correlation
Gene
r
Gene
r
LOC101883855
0.157
tob1a
-0.040
CU468723.1
0.145
her5
-0.036
CABZ01068244.1
0.126
NC-002333.24
-0.035
nampta
0.125
sept7a
-0.034
si:ch211-282j17.11
0.125
fam193a
-0.033
XLOC-013129
0.116
acp5a
-0.033
LOC108181595
0.113
tspan31
-0.033
CR769772.3
0.112
nanog
-0.033
CR396583.1
0.109
mid1ip1l
-0.031
kncn
0.109
zgc:113424
-0.031
LO017858.1
0.108
si:dkey-256h2.1
-0.031
si:ch1073-376c22.1
0.108
mark3a
-0.031
lingo3a
0.107
sox19b
-0.031
LOC101884781
0.107
si:dkeyp-46h3.8
-0.031
ky
0.106
imp3
-0.030
crybb1l2
0.105
naa15b
-0.030
march11
0.102
gcat
-0.030
AXL
0.102
dnajb11
-0.030
apln
0.097
eloal
-0.030
XLOC-021140
0.094
psmd11a
-0.029
mpp3a
0.089
gtf3ab
-0.029
LOC110439902
0.089
si:dkey-208k4.2
-0.029
CU062645.1
0.089
NC-002333.4
-0.029
BX276088.1
0.088
bola3
-0.029
FP067442.1
0.086
crebbpa
-0.028
si:ch211-165e15.1
0.085
thumpd3
-0.028
LO018422.1
0.085
erlec1
-0.028
XLOC-009525
0.085
ciarta
-0.028
adgre13
0.084
manf
-0.028
znf1166
0.083
ca15b
-0.028
zgc:194679
0.082
mknk1
-0.028
si:ch211-74m13.1
0.081
mxi1
-0.028
wu:fb63a08
0.081
fbxl6
-0.028
epdl1
0.080
tbl1xr1b
-0.027
AL935044.1
0.079
foxn2b
-0.027