Daniocell
tbc1d1 (mesenchyme)
"TBC1 (tre-2/USP6, BUB2, cdc16) domain family, member 1"
ZFIN
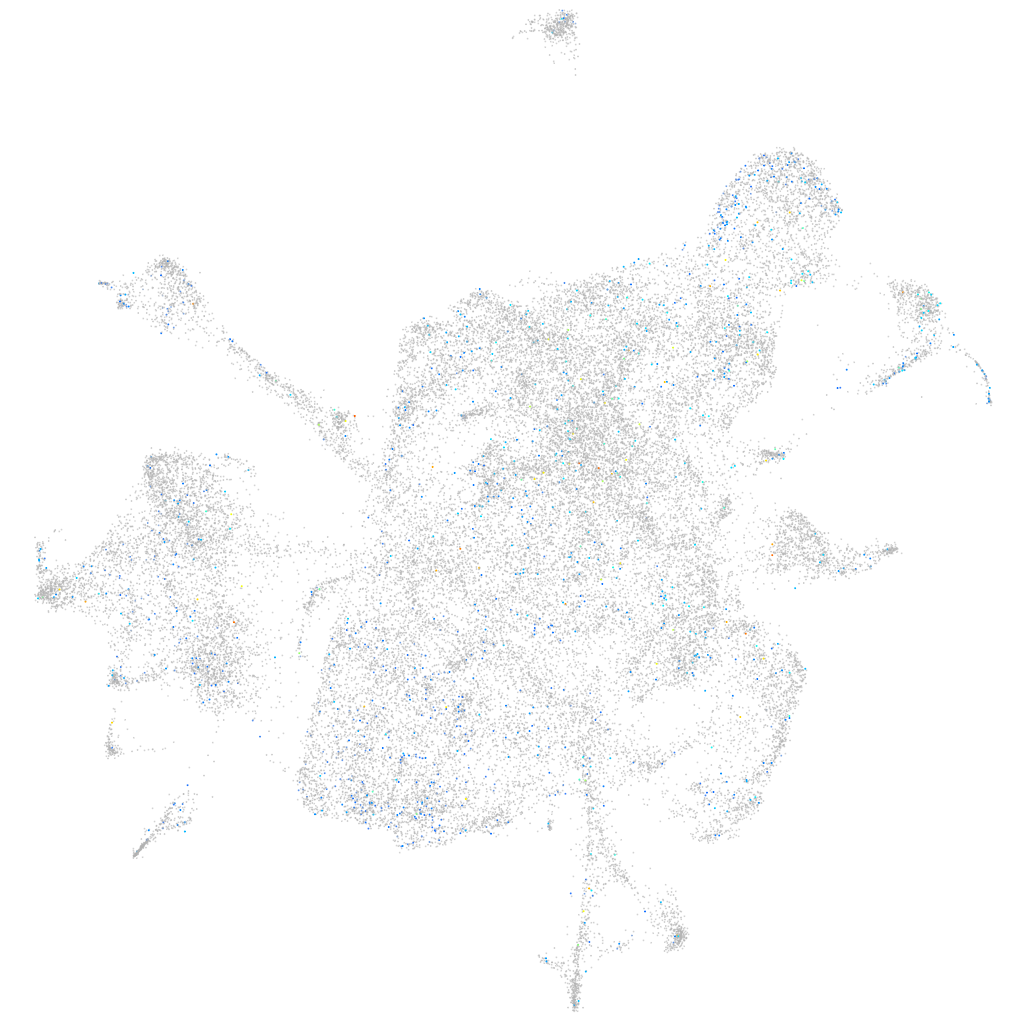
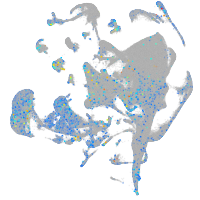
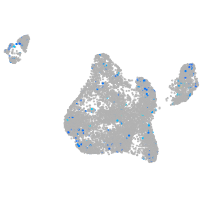
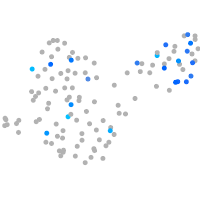
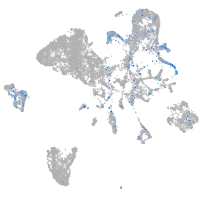
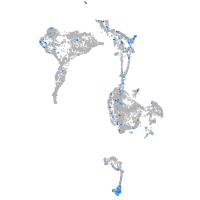
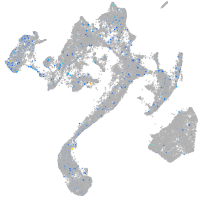
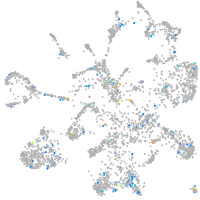
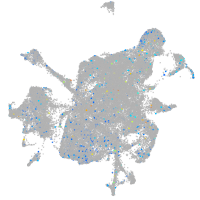
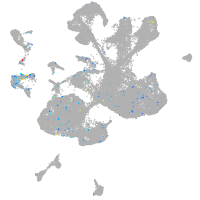
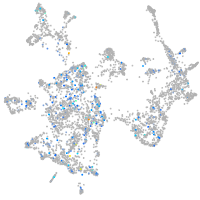
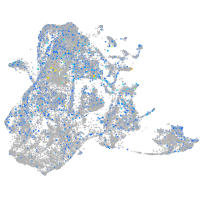
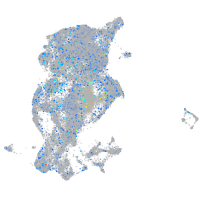
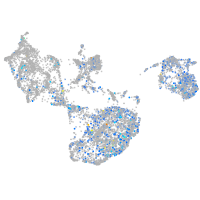
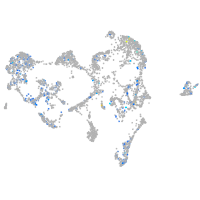
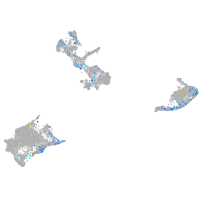
Gene expression UMAP
Display:
Expression
Stage
Other cell groups
all cells
blastomeres
PGCs
endoderm
axial mesoderm
muscle
mural cells /
non-skeletal muscle
mesenchyme
hematopoietic /
vasculature
pronephros
neural
spinal cord / glia
eye
taste / olfactory
otic / lateral line
epidermis
periderm
fin
ionocytes / mucous
pigment cells
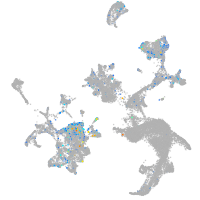
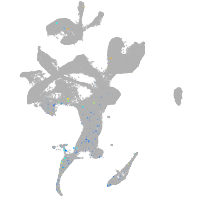
Expression by stage/cluster
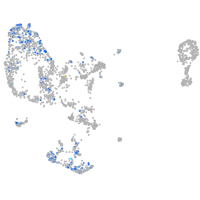
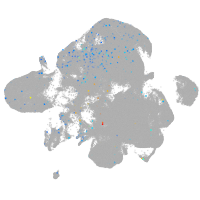
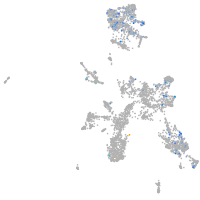
Correlated gene expression
Positive correlation
Negative correlation
Gene
r
Gene
r
emilin3a
0.061
vwde
-0.020
ppp1r1c
0.057
eif4ebp3l
-0.020
si:ch211-254p10.2
0.056
rbp4
-0.020
lrp5.2
0.052
apoa1b
-0.019
CR812470.2
0.050
rbp7b
-0.018
wu:fe17e08
0.050
cspg5a
-0.017
fgfbp2b
0.050
caly
-0.017
mir2193.1
0.049
rpl39
-0.017
wwp2
0.049
prss59.1
-0.017
si:dkey-19b23.8
0.049
XLOC-028370
-0.016
si:ch211-156j16.1
0.049
col1a2
-0.016
csf2rb
0.048
hpdb
-0.016
acana
0.048
ddx21
-0.016
LOC108179813
0.047
gpm6ab
-0.015
si:dkey-23f9.9
0.047
myl10
-0.015
LOC103910526
0.045
st8sia5
-0.015
BX072576.3
0.045
tmem132e
-0.015
mhc1lda
0.045
si:dkey-151g10.6
-0.015
BX323830.1
0.044
si:dkey-12l12.1
-0.014
hapln1b
0.043
mcm2
-0.014
zgc:162879
0.043
nhlh2
-0.014
nog3
0.042
wu:fa19b12
-0.014
BX950868.1
0.042
marcksl1a
-0.014
papss2b
0.042
tsr2
-0.014
sox6
0.042
tfap4
-0.014
il16
0.041
apoc1
-0.014
meltf
0.040
ucmaa
-0.014
col11a2
0.040
vamp2
-0.014
LOC101882826
0.040
pcp4a
-0.014
si:dkey-220a11.5
0.040
apoa2
-0.014
col11a1a
0.040
cdca7b
-0.013
col8a2
0.039
dap1b
-0.013
snorc
0.039
grem2b
-0.013
itih1
0.039
cilp
-0.013
LOC100537504
0.039
adgrl3.1
-0.013