Daniocell
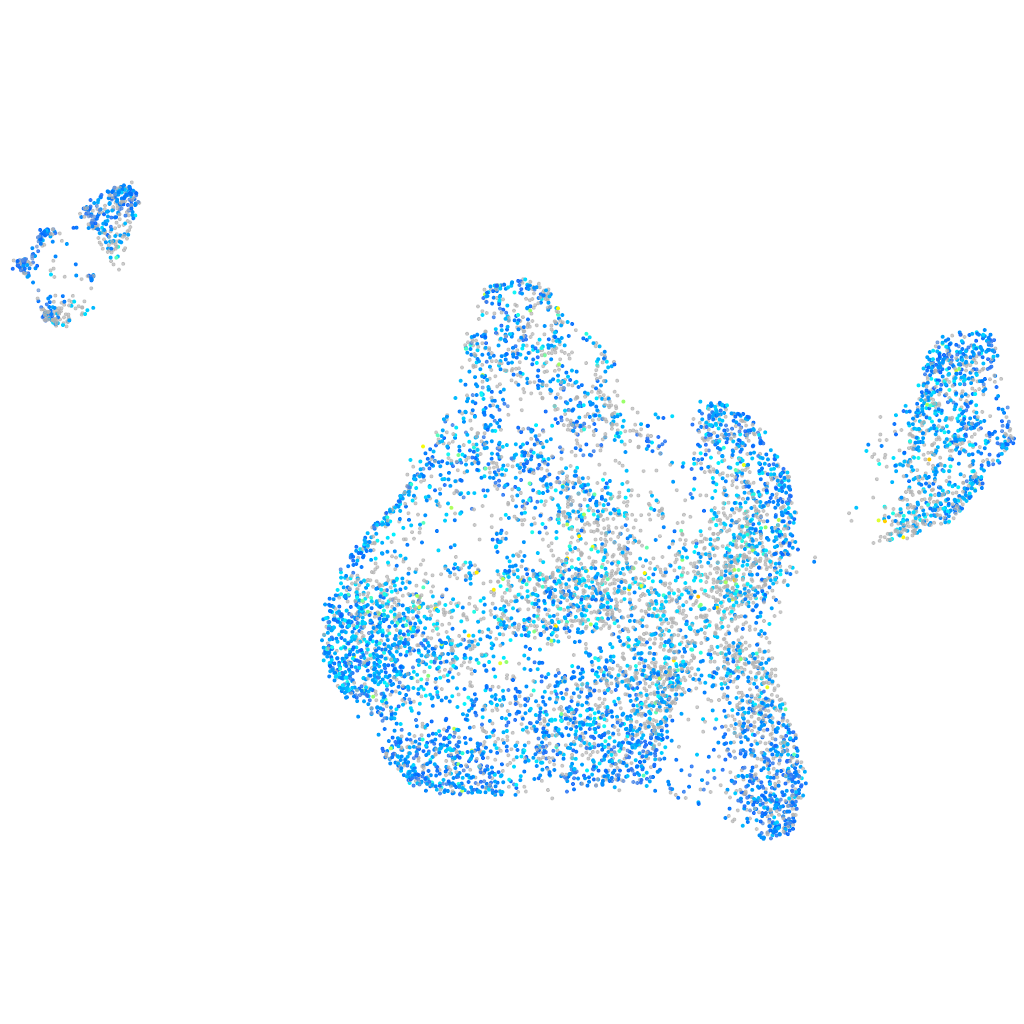
tardbpl (blastomeres)
"TAR DNA binding protein, like"
ZFIN
Gene expression UMAP
Display:
Expression
Stage
Other cell groups
all cells
blastomeres
PGCs
endoderm
axial mesoderm
muscle
mural cells /
non-skeletal muscle
mesenchyme
hematopoietic /
vasculature
pronephros
neural
spinal cord / glia
eye
taste / olfactory
otic / lateral line
epidermis
periderm
fin
ionocytes / mucous
pigment cells
Expression by stage/cluster
Correlated gene expression
Positive correlation
Negative correlation
Gene
r
Gene
r
cirbpb
0.117
NC-002333.4
-0.150
khdrbs1a
0.109
zgc:110425
-0.068
uba52
0.097
zgc:153405
-0.055
rpl6
0.097
si:dkey-23a13.17
-0.051
nop58
0.097
si:dkey-108k21.10
-0.047
CR383676.1
0.096
si:dkey-261m9.12
-0.045
gar1
0.096
gsc
-0.039
dkc1
0.094
si:ch211-113a14.18
-0.039
tuba8l4
0.094
XLOC-043685
-0.039
cpsf6
0.093
si:ch73-36p18.1
-0.037
pabpc1a
0.092
FO704836.1
-0.037
ewsr1a
0.091
pcnt
-0.036
rpl22
0.091
CABZ01113954.1
-0.035
srsf5a
0.090
rnf128a
-0.035
rpl28
0.090
sulf1
-0.035
hnrnph1l
0.089
si:ch211-98n17.5
-0.034
nop56
0.088
CABZ01090785.1
-0.033
tubb2b
0.087
ppp1r15a
-0.033
tardbp
0.087
fbxl2
-0.033
hnrnpa1b
0.086
fastkd2
-0.033
rpl14
0.086
tmem222b
-0.033
mcm3
0.085
si:dkey-43p13.5
-0.032
rpl4
0.084
irak4
-0.032
ddx39ab
0.084
tfe3a
-0.031
tpt1
0.084
taok3a
-0.031
polr3gla
0.083
btg4
-0.031
rpl35
0.082
pibf1
-0.031
rpl29
0.082
erbb3b
-0.030
ppig
0.081
BX323074.2
-0.030
rimkla
0.081
pip4k2aa
-0.030
nnr
0.080
slc7a6
-0.030
ddx5
0.080
zgc:56231
-0.030
myef2
0.079
si:ch211-204c21.1
-0.030
rps23
0.079
si:ch73-368j24.11
-0.030
rps25
0.079
ezrb
-0.030