Daniocell
taok2a (otic / lateral line)
TAO kinase 2a
ZFIN
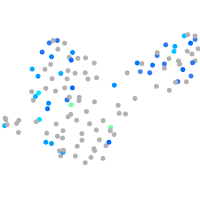
Gene expression UMAP
Display:
Expression
Stage
Other cell groups
all cells
blastomeres
PGCs
endoderm
axial mesoderm
muscle
mural cells /
non-skeletal muscle
mesenchyme
hematopoietic /
vasculature
pronephros
neural
spinal cord / glia
eye
taste / olfactory
otic / lateral line
epidermis
periderm
fin
ionocytes / mucous
pigment cells
Expression by stage/cluster
Correlated gene expression
Positive correlation
Negative correlation
Gene
r
Gene
r
or102-2
0.187
BX248331.2
-0.039
LOC108179947
0.151
prss1
-0.038
wfikkn2b
0.127
tex33
-0.037
taar18c
0.127
s100s
-0.037
taar20c
0.127
dynlt1
-0.037
taar20r
0.127
katnal2
-0.036
or111-1
0.126
smyhc1
-0.036
tulp4b
0.123
si:ch211-147k9.8
-0.036
FP016235.1
0.119
ttn.2
-0.036
pi4kab
0.118
hbae3
-0.036
erbb4b
0.118
irak1bp1
-0.036
LOC100151570
0.115
efcab2
-0.036
LOC110438262
0.115
si:dkey-27p23.3
-0.035
CABZ01066312.1
0.112
mylpfa
-0.035
grm1b
0.112
ckmb
-0.034
XLOC-015741
0.112
tomt
-0.034
CABZ01011209.1
0.111
LOC103908836
-0.034
si:dkey-182g1.10
0.107
DYNC2H1
-0.034
FP565432.1
0.106
s100t
-0.034
si:ch73-174h16.5
0.105
trappc2l
-0.034
LOC110440098
0.101
kif1aa
-0.034
gbf1
0.098
myhz1.1
-0.033
si:cabz01054394.5
0.098
galnt9
-0.033
adcy2a
0.092
anxa5a
-0.032
eif4e1b
0.091
CELA1 (1 of many)
-0.032
LOC108179158
0.091
actc1b
-0.032
si:dkey-58f6.2
0.090
dnah9l
-0.032
TMEM236
0.089
adipor2
-0.032
CR392012.2
0.088
wbp2
-0.031
klhl24a
0.088
spaca9
-0.031
XLOC-020465
0.088
CABZ01068050.1
-0.031
ackr4b
0.087
cd164l2
-0.031
si:ch211-212d10.1
0.086
tlr7
-0.031
C14orf28
0.086
slitrk2
-0.031
si:ch73-288o11.5
0.086
BX537274.2
-0.031