Daniocell
tab3 (epidermis)
TGF-beta activated kinase 1 (MAP3K7) binding protein 3
ZFIN
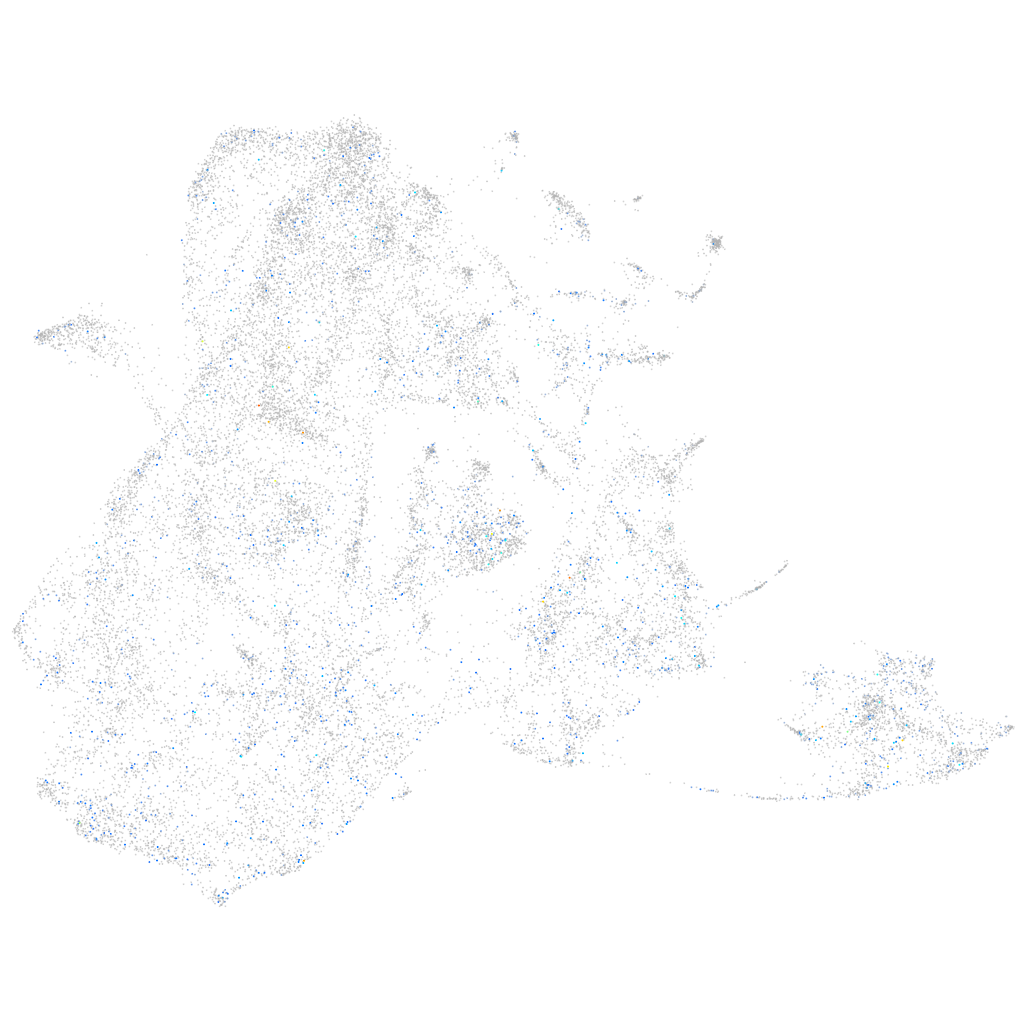
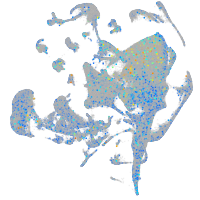
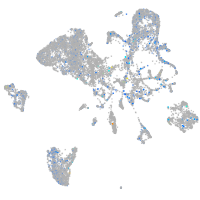
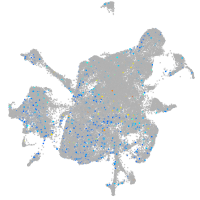
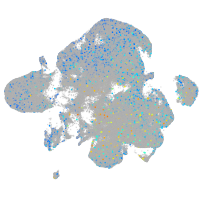
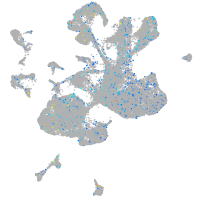
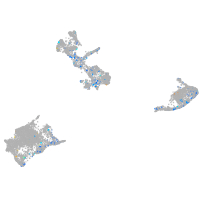
Gene expression UMAP
Display:
Expression
Stage
Other cell groups
all cells
blastomeres
PGCs
endoderm
axial mesoderm
muscle
mural cells /
non-skeletal muscle
mesenchyme
hematopoietic /
vasculature
pronephros
neural
spinal cord / glia
eye
taste / olfactory
otic / lateral line
epidermis
periderm
fin
ionocytes / mucous
pigment cells
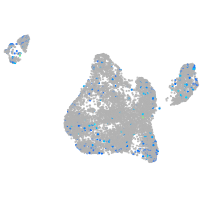
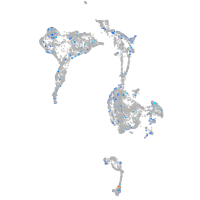
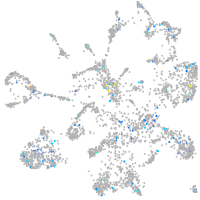
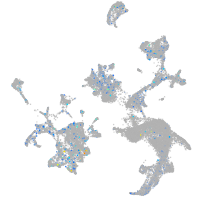
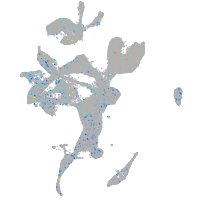
Expression by stage/cluster
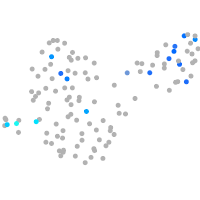
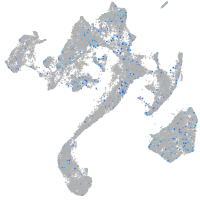
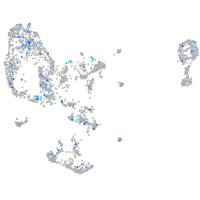
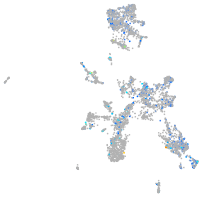
Correlated gene expression
Positive correlation
Negative correlation
Gene
r
Gene
r
AL929435.2
0.125
col1a2
-0.058
XLOC-019901
0.117
krt5
-0.057
gpx2
0.100
krtt1c19e
-0.057
si:dkey-9i23.4
0.086
rbp4
-0.057
XLOC-005580
0.082
pfn1
-0.056
tubb2b
0.081
sparc
-0.055
CR392012.2
0.078
cldn1
-0.054
pax2b
0.074
si:dkey-33c14.3
-0.054
si:ch211-288g17.3
0.074
zgc:136930
-0.053
smarca4a
0.073
tmsb4x
-0.053
hmgn2
0.072
krt91
-0.052
si:ch1073-44g3.1
0.071
col1a1b
-0.051
si:dkey-33i11.1
0.071
si:dkey-183i3.5
-0.051
snrpd1
0.070
wu:fa03e10
-0.049
LOC100537585
0.070
ecrg4b
-0.049
seta
0.069
si:dkey-16p21.8
-0.048
hmgb2b
0.069
col1a1a
-0.048
hdac1
0.068
aldh9a1a.1
-0.048
h2afvb
0.067
cxl34b.11
-0.048
nucks1a
0.066
zgc:86896
-0.046
hnrnpabb
0.066
zgc:175088
-0.046
rad21a
0.066
cdo1
-0.046
BX649341.1
0.065
ptgdsb.1
-0.045
h3f3a
0.065
lgals1l1
-0.044
LOC101884169
0.064
gamt
-0.043
sinhcafl
0.063
col17a1a
-0.043
cirbpa
0.063
cotl1
-0.042
cfl1
0.063
col2a1b
-0.042
hnrnpa0b
0.063
cyt1l
-0.042
khdrbs1a
0.063
cfl1l
-0.041
smc2
0.063
itgb4
-0.041
lsm8
0.062
tmsb1
-0.041
cldnb
0.062
postnb
-0.041
hmgb2a
0.062
spaca4l
-0.041
BX511079.2
0.062
epgn
-0.041