
sulfatase modifying factor 1
ZFIN 
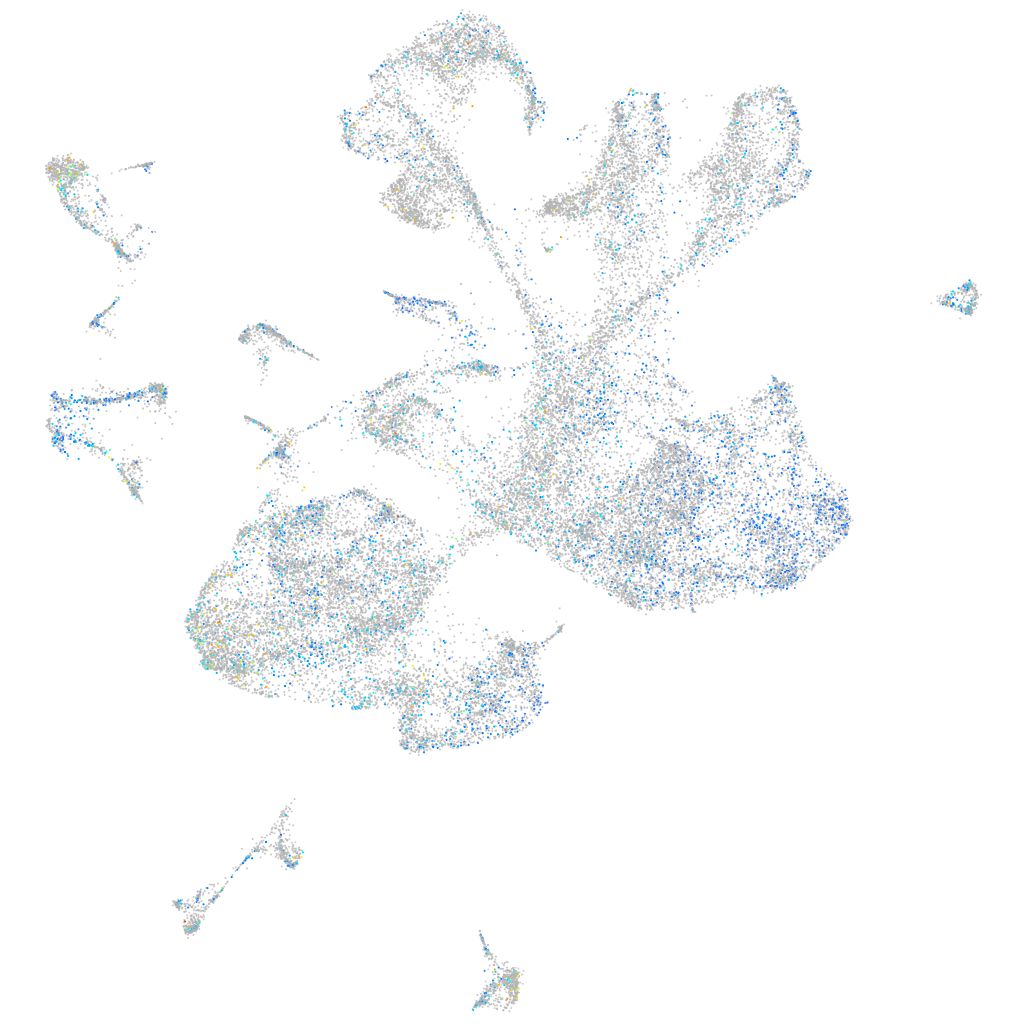
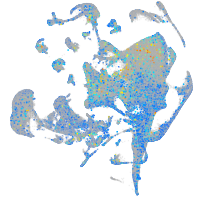
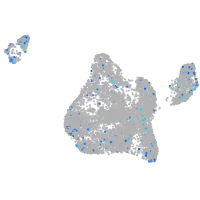
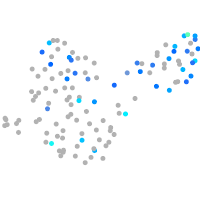
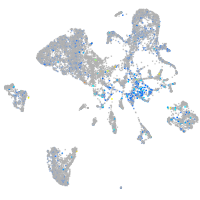
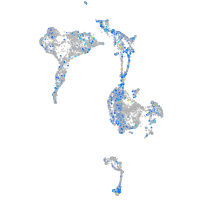
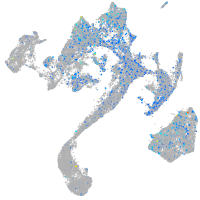
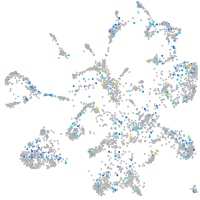
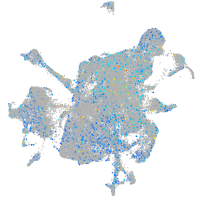
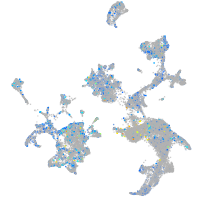
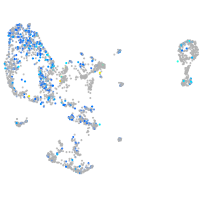
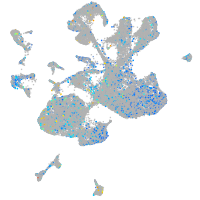
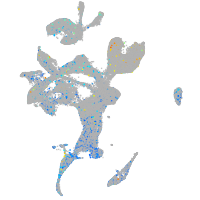
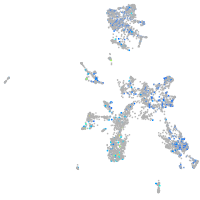
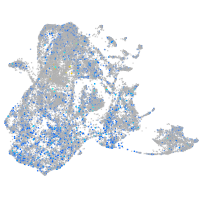
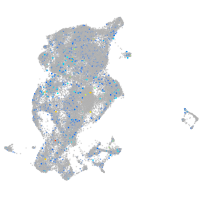
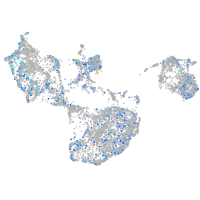
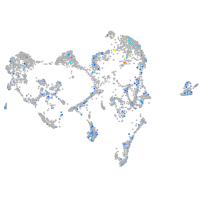
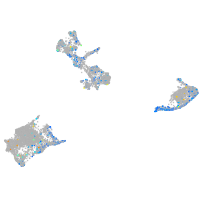
Gene expression UMAP


Expression by stage/cluster
Correlated gene expression
| Positive correlation | Negative correlation | ||
| Gene | r | Gene | r |
| p4ha1b | 0.078 | elavl3 | -0.057 |
| fosab | 0.067 | tmsb | -0.056 |
| oc90 | 0.066 | myt1b | -0.056 |
| p4ha2 | 0.062 | elavl4 | -0.052 |
| FQ323156.1 | 0.062 | si:ch73-1a9.3 | -0.050 |
| sparc | 0.061 | ptmaa | -0.050 |
| col8a1a | 0.061 | pik3r3b | -0.049 |
| tpm4a | 0.060 | chd4a | -0.048 |
| sdc4 | 0.058 | ptmab | -0.046 |
| tegt | 0.058 | hmgb3a | -0.045 |
| loxl5b | 0.057 | stmn1b | -0.045 |
| aldoaa | 0.057 | FO082781.1 | -0.044 |
| eif4ebp3l | 0.057 | hmgb1a | -0.044 |
| XLOC-044191 | 0.056 | hmgb1b | -0.043 |
| spon1b | 0.056 | zfhx3 | -0.043 |
| vamp3 | 0.056 | si:ch73-386h18.1 | -0.040 |
| mgst3b | 0.056 | LOC100537384 | -0.039 |
| sdcbp2 | 0.055 | mab21l2 | -0.037 |
| wls | 0.054 | onecut1 | -0.036 |
| bicc2 | 0.054 | rtn1a | -0.036 |
| her9 | 0.053 | islr2 | -0.035 |
| npc2 | 0.053 | pou2f2a | -0.035 |
| anxa13 | 0.053 | tuba1c | -0.035 |
| ifi30 | 0.053 | nova2 | -0.035 |
| atp1b1a | 0.053 | si:ch211-57n23.4 | -0.035 |
| her6 | 0.052 | cdk5r1b | -0.035 |
| igf2b | 0.052 | sox11b | -0.035 |
| optc | 0.051 | golga7ba | -0.035 |
| tmed2 | 0.051 | gng2 | -0.034 |
| sept10 | 0.051 | tubb2b | -0.034 |
| si:dkey-7j14.6 | 0.051 | rbfox3a | -0.034 |
| ppib | 0.051 | rbfox1 | -0.033 |
| itm2ba | 0.051 | zc4h2 | -0.033 |
| cd63 | 0.050 | add2 | -0.033 |
| pgam1a | 0.050 | casz1 | -0.033 |