
SUN domain containing ossification factor
ZFIN 
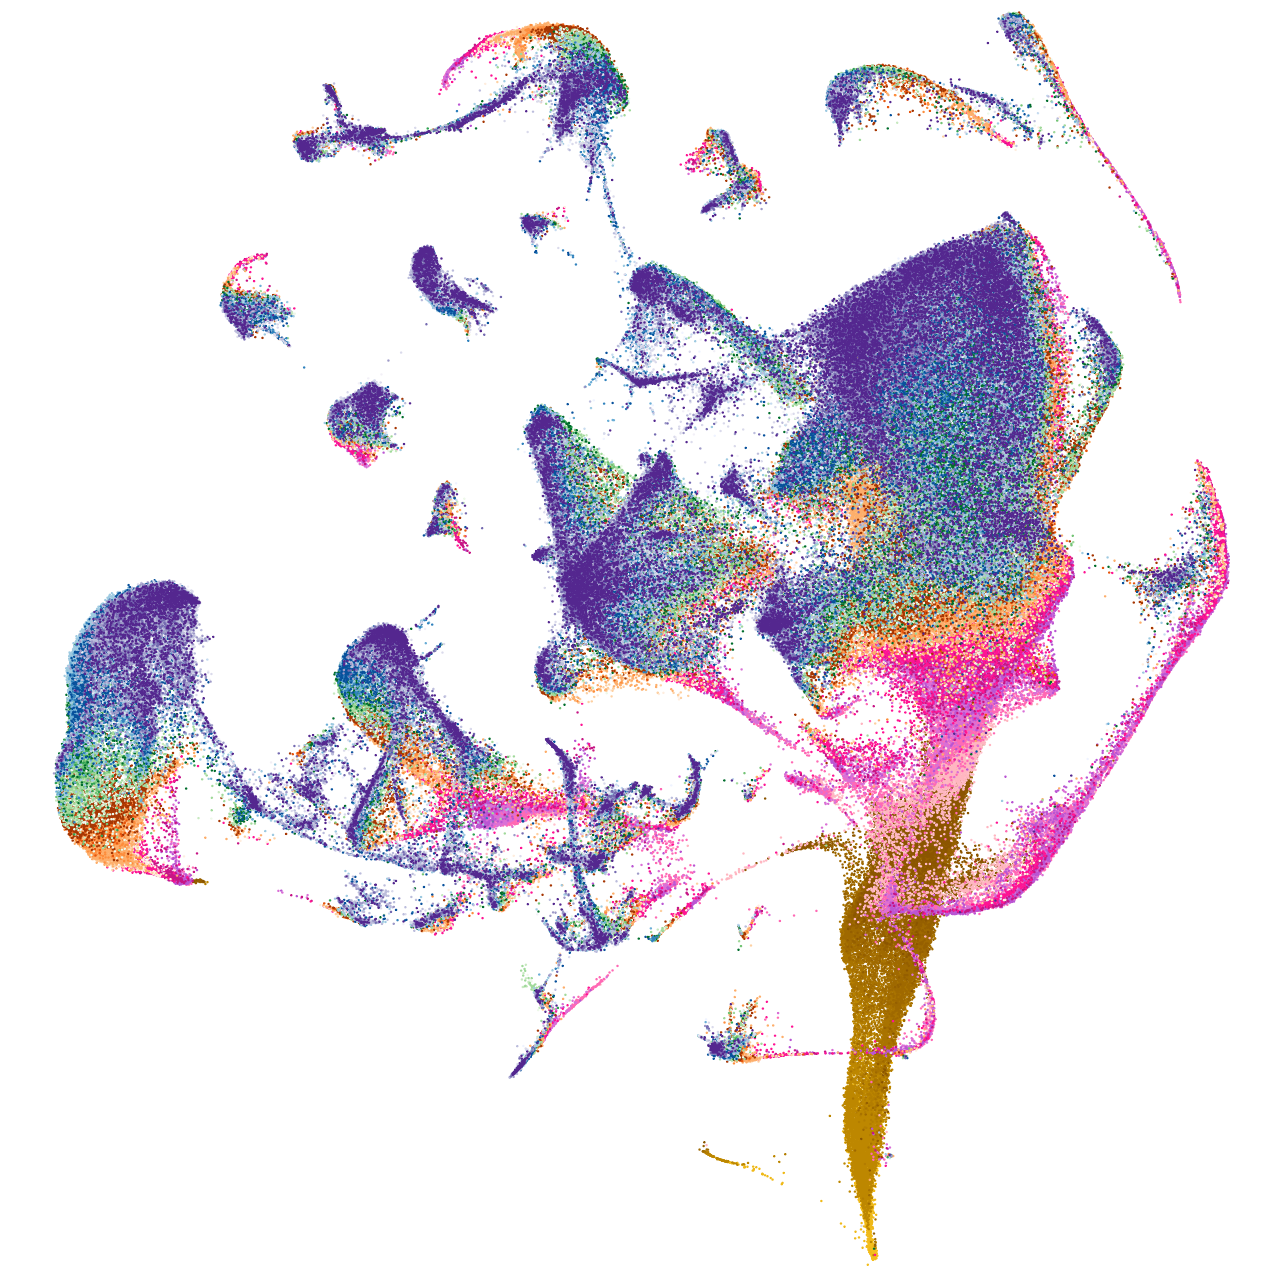
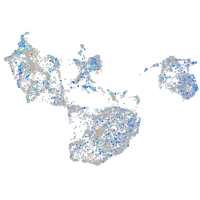
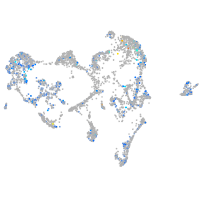
Gene expression UMAP


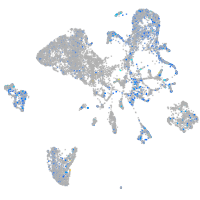


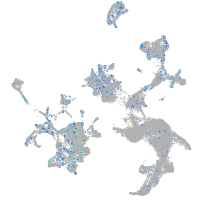


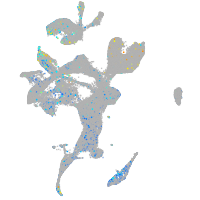


Expression by stage/cluster
Correlated gene expression
| Positive correlation | Negative correlation | ||
| Gene | r | Gene | r |
| gnb1a | 0.055 | hspb1 | -0.039 |
| tkta | 0.048 | apoc1 | -0.031 |
| cd63 | 0.043 | dkc1 | -0.031 |
| ier2b | 0.043 | npm1a | -0.031 |
| fosab | 0.042 | nop58 | -0.030 |
| gnao1a | 0.042 | anp32e | -0.029 |
| si:ch211-129p13.1 | 0.042 | fbl | -0.029 |
| ccni | 0.041 | zmp:0000000624 | -0.028 |
| ptprfb | 0.041 | polr3gla | -0.027 |
| b2ml | 0.041 | si:dkey-66i24.9 | -0.027 |
| calm1a | 0.041 | snu13b | -0.027 |
| gapdhs | 0.040 | pou5f3 | -0.026 |
| hist2h2l | 0.040 | cdca7a | -0.025 |
| selenow1 | 0.040 | ebna1bp2 | -0.025 |
| stx1b | 0.039 | gar1 | -0.025 |
| cldn7a | 0.038 | nop2 | -0.025 |
| hepacama | 0.038 | rbmx2 | -0.025 |
| isl2b | 0.038 | si:ch211-152c2.3 | -0.025 |
| pleca | 0.038 | bms1 | -0.024 |
| ptn | 0.038 | COX7A2 | -0.024 |
| CU862020.1 | 0.038 | cx43.4 | -0.024 |
| syt1a | 0.038 | ddx18 | -0.024 |
| eno2 | 0.037 | gnl3 | -0.024 |
| hmx4 | 0.037 | hnrnpa1b | -0.024 |
| sv2a | 0.037 | lig1 | -0.024 |
| syt11a | 0.037 | nhp2 | -0.024 |
| stxbp1a | 0.037 | nop56 | -0.024 |
| atp2b2 | 0.036 | s100a1 | -0.024 |
| bsg | 0.036 | ube2c | -0.024 |
| btg2 | 0.036 | anp32b | -0.023 |
| cadm4 | 0.036 | asb11 | -0.023 |
| chac1 | 0.036 | mcm3 | -0.023 |
| lasp1 | 0.036 | mcm6 | -0.023 |
| nfe2l2a | 0.036 | rrp15 | -0.023 |
| pfn2 | 0.036 | si:ch1073-80i24.3 | -0.023 |