Daniocell
stim1a (mural cells / non-skeletal muscle)
stromal interaction molecule 1a
ZFIN
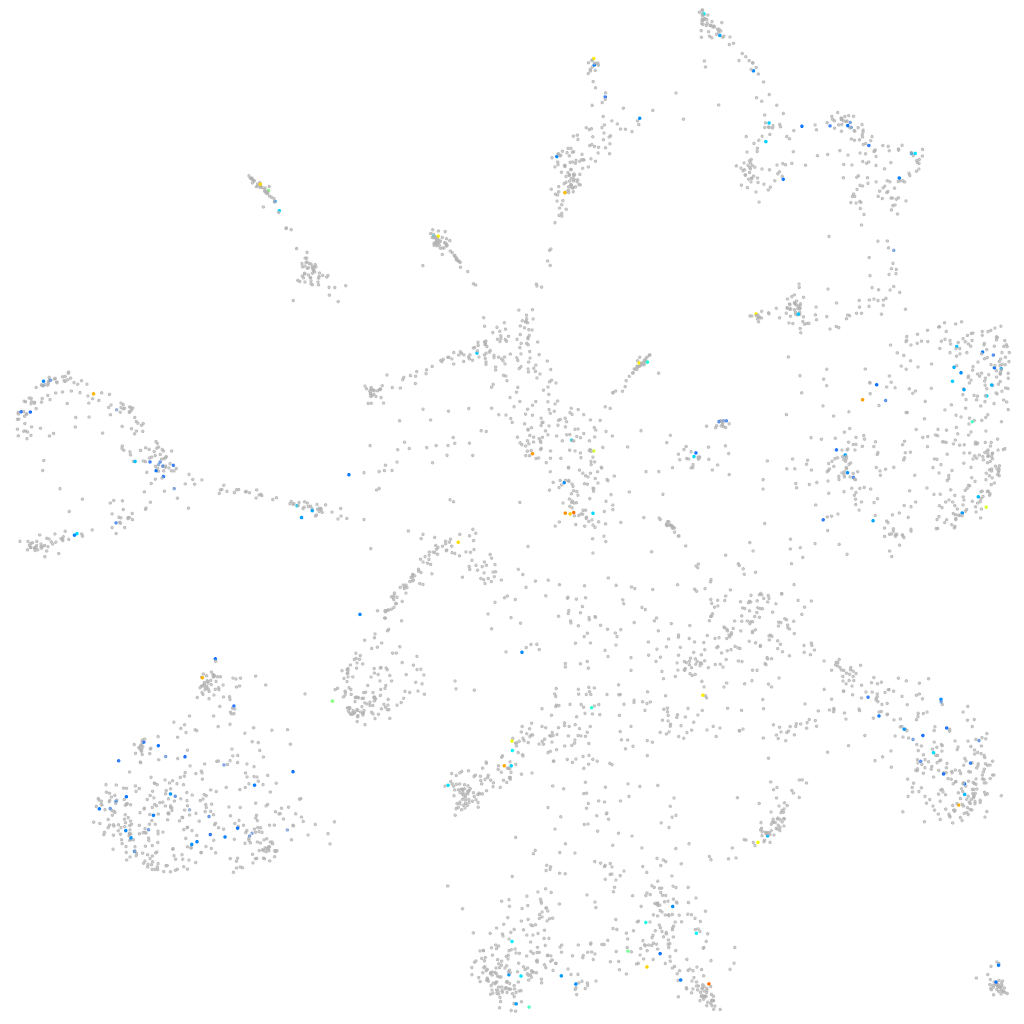
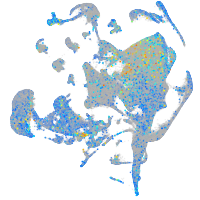
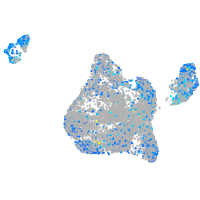
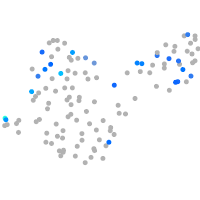
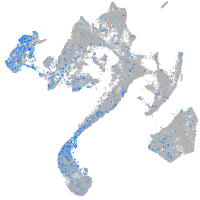
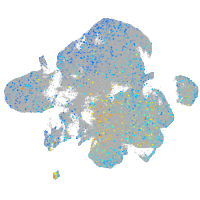
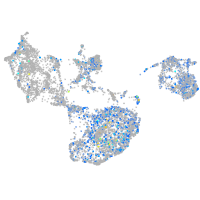
Gene expression UMAP
Display:
Expression
Stage
Other cell groups
all cells
blastomeres
PGCs
endoderm
axial mesoderm
muscle
mural cells /
non-skeletal muscle
mesenchyme
hematopoietic /
vasculature
pronephros
neural
spinal cord / glia
eye
taste / olfactory
otic / lateral line
epidermis
periderm
fin
ionocytes / mucous
pigment cells
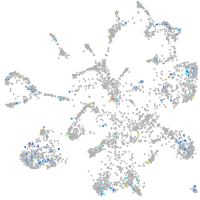
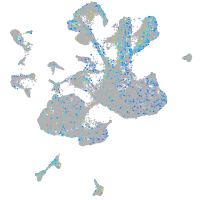
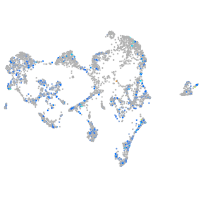
Expression by stage/cluster
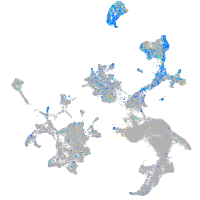
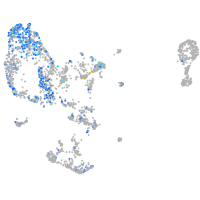
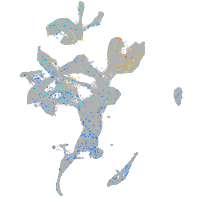
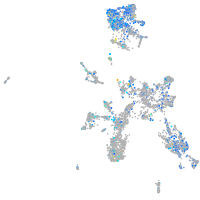
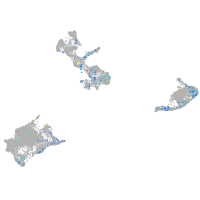
Correlated gene expression
Positive correlation
Negative correlation
Gene
r
Gene
r
tfcp2l1
0.172
nkx2.3
-0.054
si:ch211-227p7.5
0.164
rplp2l
-0.052
ppp2r5ca
0.163
rpl36a
-0.050
CR388132.1
0.162
cyr61
-0.049
alpk3a
0.161
COX3
-0.048
CT737190.2
0.148
psma6a
-0.046
tdrd12
0.145
rpl35a
-0.046
BX571705.1
0.141
rprmb
-0.045
zgc:158701
0.140
crebzf
-0.044
si:ch211-191a16.2
0.139
rpl31
-0.043
FP245456.1
0.138
si:dkey-151g10.6
-0.042
si:dkeyp-68b7.10
0.134
entpd1
-0.042
si:dkeyp-85e10.3
0.131
calub
-0.042
adrb2b
0.129
klf11b
-0.042
si:dkey-29d5.2
0.129
nkx3.3
-0.040
LOC108190590
0.128
si:ch211-222l21.1
-0.039
igf2a
0.127
p4ha2
-0.039
mir132-1
0.122
sdc2
-0.039
znf1067
0.122
rpl18
-0.039
XLOC-040812
0.121
zgc:56095
-0.039
BX547992.1
0.120
tma7
-0.039
P2RY14
0.119
tgfb2
-0.039
axdnd1
0.110
col1a1a
-0.038
sgk2b
0.109
hmga1a
-0.038
cbln10
0.108
rcn3
-0.038
cx39.4
0.107
copb2
-0.038
XLOC-042515
0.106
rbm4.3
-0.038
otud4
0.105
si:ch211-160j14.3
-0.038
zgc:154086
0.105
fundc2
-0.038
mettl22
0.105
ppp1r7
-0.038
dcst2
0.103
tead3b
-0.037
PLEKHB1
0.102
aldh6a1
-0.037
dlk2
0.102
uba52
-0.037
LOC795766
0.102
EML4
-0.037
CR792438.2
0.100
cdh11
-0.036