Daniocell
st7l (blastomeres)
suppression of tumorigenicity 7 like
ZFIN
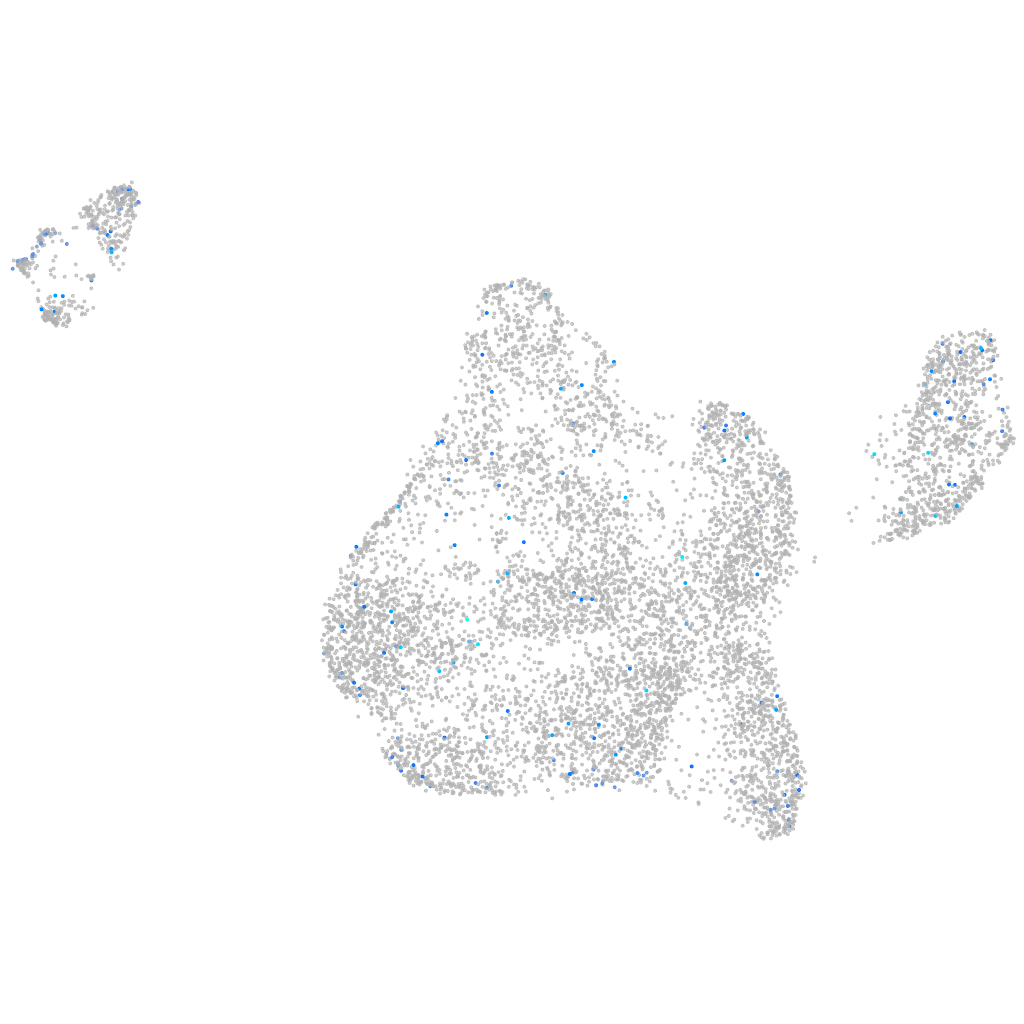
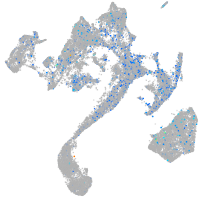
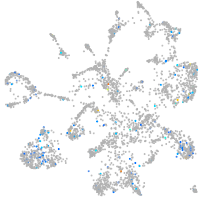
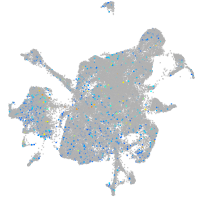
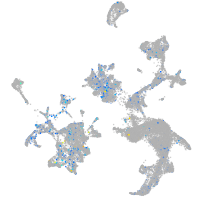
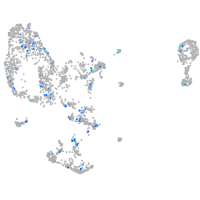
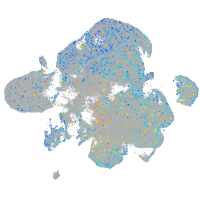
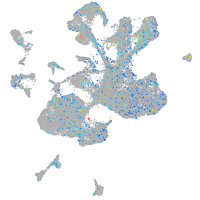
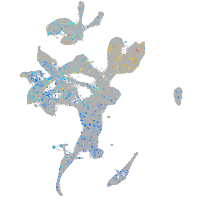
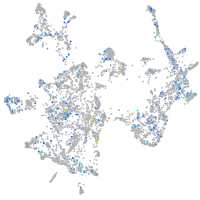
Gene expression UMAP
Display:
Expression
Stage
Other cell groups
all cells
blastomeres
PGCs
endoderm
axial mesoderm
muscle
mural cells /
non-skeletal muscle
mesenchyme
hematopoietic /
vasculature
pronephros
neural
spinal cord / glia
eye
taste / olfactory
otic / lateral line
epidermis
periderm
fin
ionocytes / mucous
pigment cells
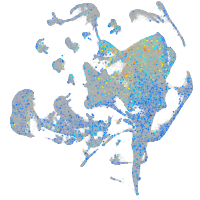
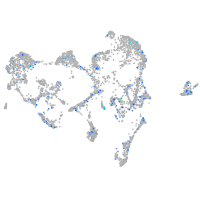
Expression by stage/cluster
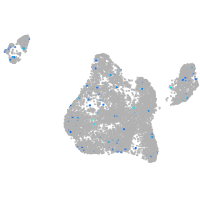
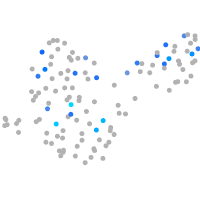
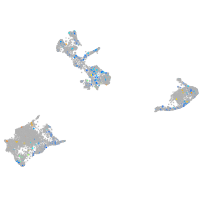
Correlated gene expression
Positive correlation
Negative correlation
Gene
r
Gene
r
camk4
0.119
hmgb2a
-0.061
fmnl1a
0.117
stm
-0.057
grin1b
0.114
marcksl1b
-0.057
emilin3a
0.108
si:ch211-152c2.3
-0.057
lhx2a
0.105
si:ch211-222l21.1
-0.054
wnt9b
0.105
si:ch73-1a9.3
-0.054
LO017858.1
0.102
dynll1
-0.054
si:dkey-11o1.7
0.101
NC-002333.4
-0.053
LOC103911624
0.100
hnrnpa0b
-0.053
CR384085.1
0.100
eef1a1l1
-0.053
mmp21
0.099
nucks1a
-0.050
si:ch73-14h1.2
0.099
aldob
-0.049
si:dkey-4c2.11
0.098
ptmab
-0.048
ifng1
0.098
hmga1a
-0.048
si:dkey-221l4.11
0.095
akap12b
-0.046
CMKLR1
0.094
si:dkey-151g10.6
-0.046
CR762475.1
0.092
hspb1
-0.045
BX601646.1
0.090
rpl11
-0.043
nmur3
0.090
rps16
-0.042
ceacam1
0.086
setb
-0.042
h2af1al
0.085
rpl19
-0.040
fbln7
0.084
hmgn6
-0.039
shank1
0.083
rps8a
-0.039
si:ch211-272h9.6
0.083
atp1b1a
-0.039
si:dkey-206f10.1
0.082
ybx1
-0.038
si:ch211-12e13.12
0.081
si:dkey-66i24.9
-0.038
ngs
0.080
rps19
-0.038
CR936540.1
0.080
rps21
-0.038
si:ch73-281f12.4
0.080
rps15
-0.037
LOC103909584
0.079
anp32e
-0.037
macc1
0.079
rps23
-0.037
AL807792.1
0.079
anp32a
-0.037
XLOC-026821
0.079
cnbpb
-0.037
BX005402.1
0.077
rpl21
-0.037
matk
0.077
rps15a
-0.036