Daniocell
srpx2 (taste / olfactory)
sushi-repeat containing protein X-linked 2
ZFIN
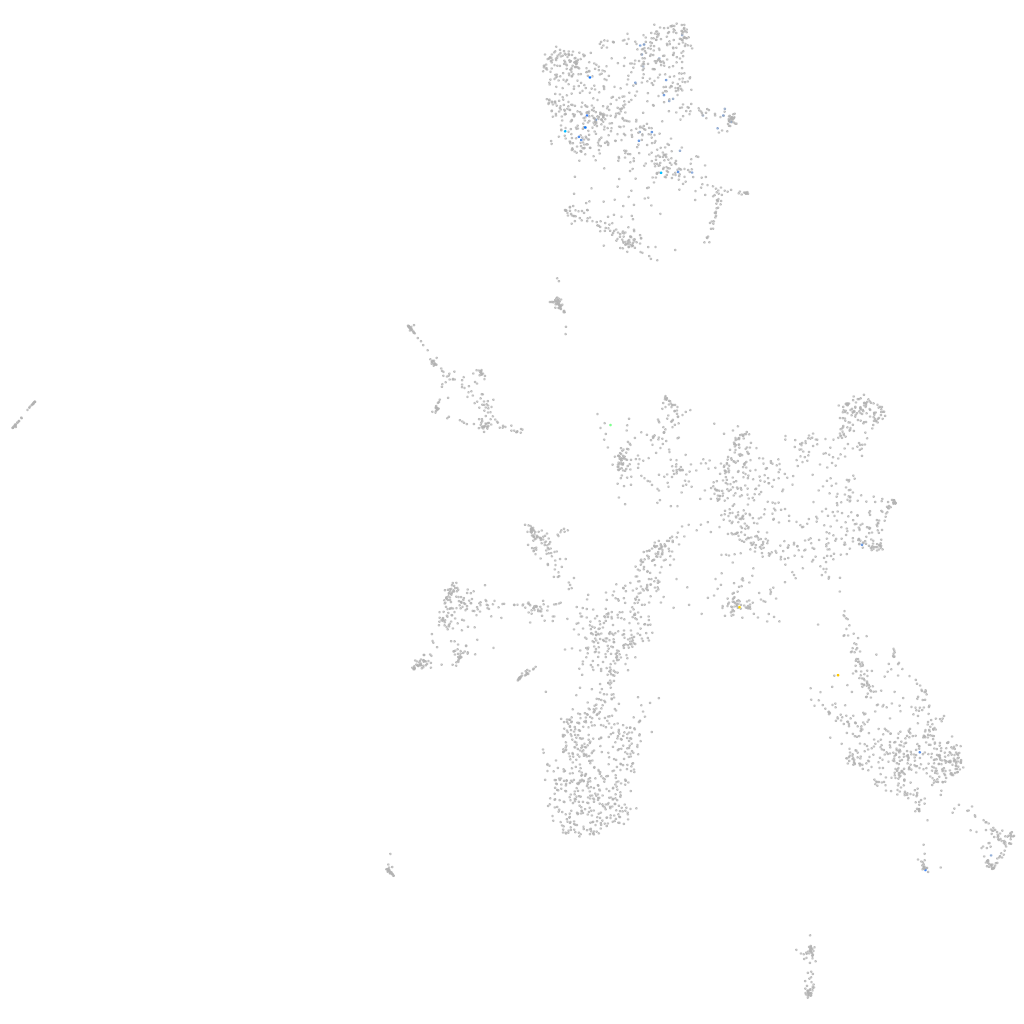
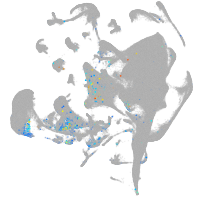
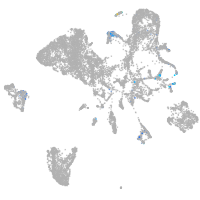
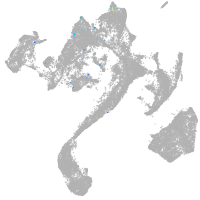
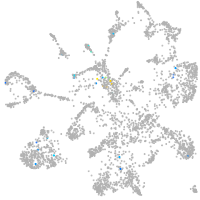
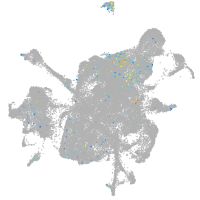
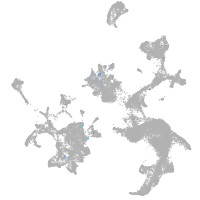
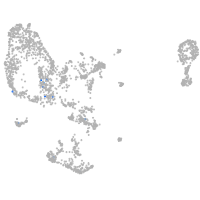
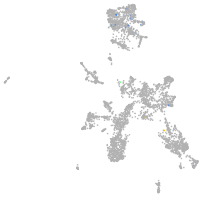
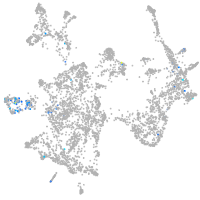
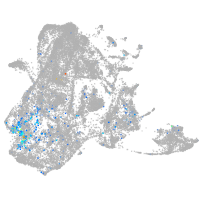
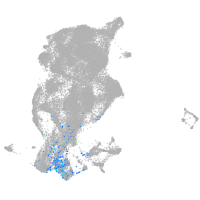
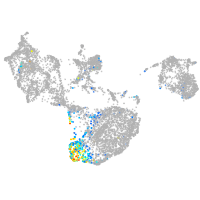
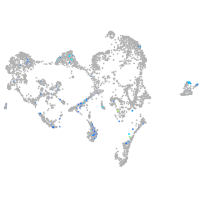
Gene expression UMAP
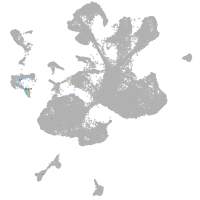
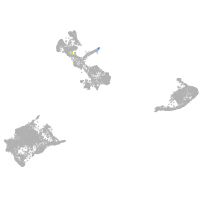
Display:
Expression
Stage
Other cell groups
all cells
blastomeres
PGCs
endoderm
axial mesoderm
muscle
mural cells /
non-skeletal muscle
mesenchyme
hematopoietic /
vasculature
pronephros
neural
spinal cord / glia
eye
taste / olfactory
otic / lateral line
epidermis
periderm
fin
ionocytes / mucous
pigment cells
Expression by stage/cluster
Correlated gene expression
Positive correlation
Negative correlation
Gene
r
Gene
r
ghrl
0.489
ptmaa
-0.077
ndufs1
0.431
dynll1
-0.068
hhex
0.430
atp5mc1
-0.065
a1cf
0.394
elavl3
-0.059
phkg1b
0.392
hmgn7
-0.058
BX323559.3
0.377
tmsb
-0.057
CR354372.1
0.375
psmb1
-0.056
LOC101885494
0.370
si:ch73-1a9.3
-0.056
dpep1
0.368
calm3b
-0.054
sst1.2
0.358
lsm6
-0.053
pax4
0.358
hmgb1b
-0.052
LOC100003133
0.358
ndufa4l
-0.049
CR354610.1
0.357
si:dkey-276j7.1
-0.049
si:dkey-269o24.1
0.356
tspan2a
-0.047
slc13a5b
0.348
vdac1
-0.047
rph3aa
0.337
hmgb3a
-0.046
pdx1
0.329
pvalb5
-0.045
XLOC-007520
0.311
gng3
-0.045
gucy2c
0.301
si:dkeyp-75h12.5
-0.044
si:ch211-149b19.4
0.296
zgc:65894
-0.044
ca12
0.295
adcyap1b
-0.044
sst2
0.289
tmeff1b
-0.043
XLOC-030238
0.279
stmn1b
-0.042
CR550302.1
0.277
mt-nd1
-0.042
scpp5
0.274
si:ch211-288g17.3
-0.042
duox2
0.272
zgc:55461
-0.042
odam
0.268
ebf3a
-0.042
fdx1b
0.267
gnb1a
-0.042
hoxc11b
0.266
hnrnpaba
-0.042
LOC101883493
0.261
LOC100537342
-0.042
RF00413
0.259
si:ch211-137a8.4
-0.042
slc6a14
0.258
ube2e1
-0.042
si:ch211-13f8.1
0.253
atf5a
-0.042
rprmb
0.253
chga
-0.041
mxra5a
0.245
ywhabl
-0.041