Daniocell
spata18 (taste / olfactory)
spermatogenesis associated 18
ZFIN
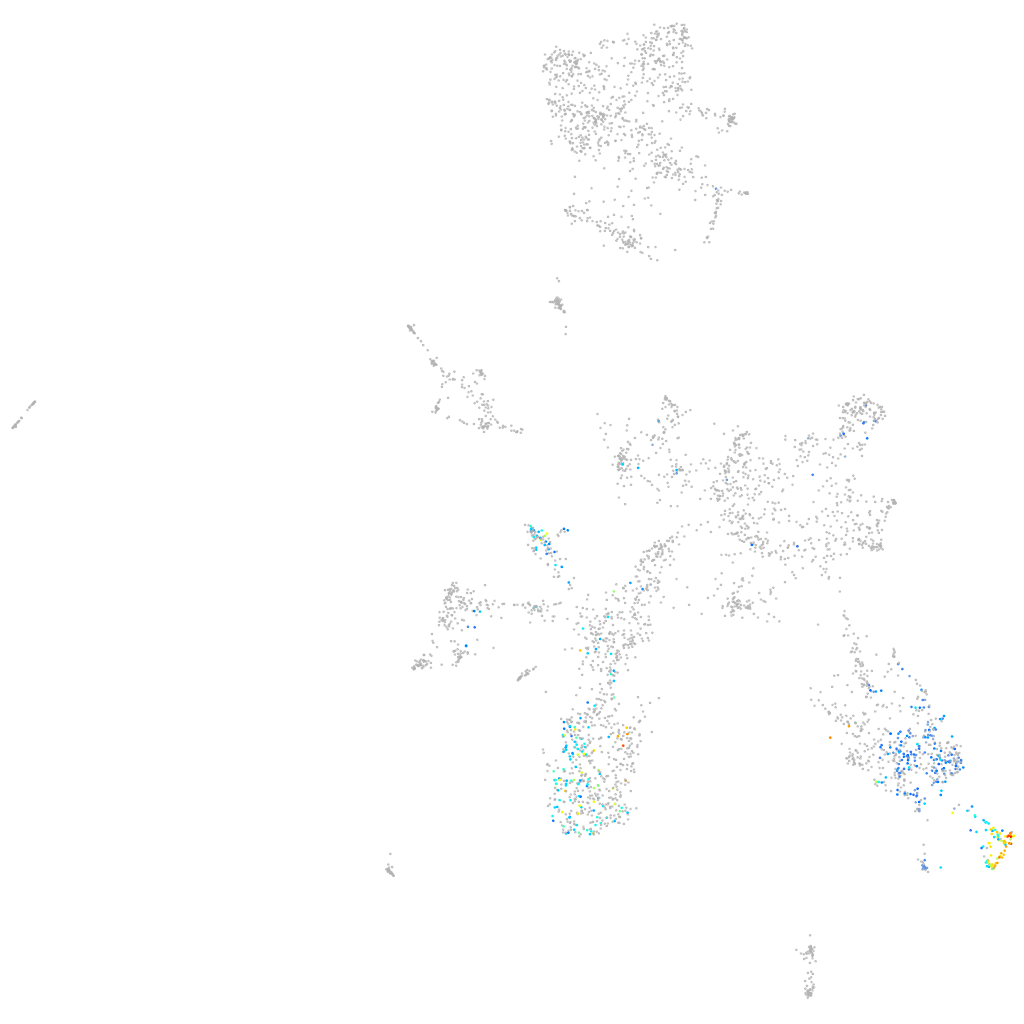
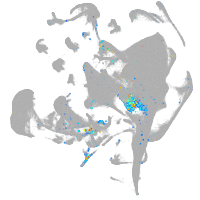
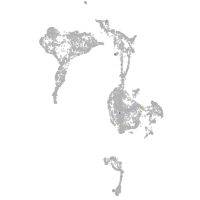
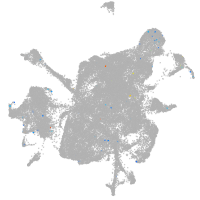
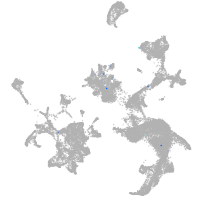
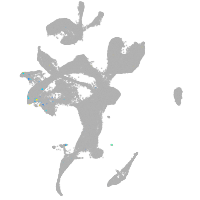
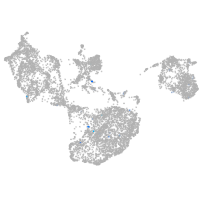
Gene expression UMAP
Display:
Expression
Stage
Other cell groups
all cells
blastomeres
PGCs
endoderm
axial mesoderm
muscle
mural cells /
non-skeletal muscle
mesenchyme
hematopoietic /
vasculature
pronephros
neural
spinal cord / glia
eye
taste / olfactory
otic / lateral line
epidermis
periderm
fin
ionocytes / mucous
pigment cells
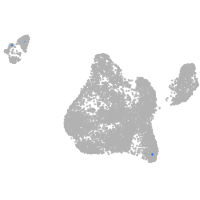
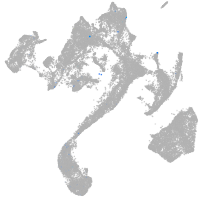
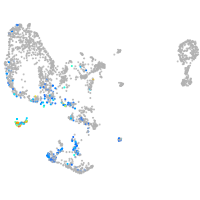
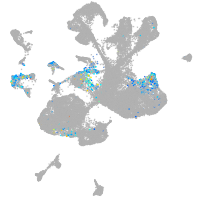
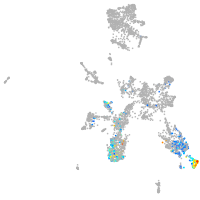
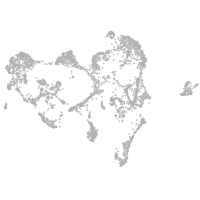
Expression by stage/cluster
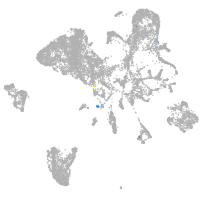
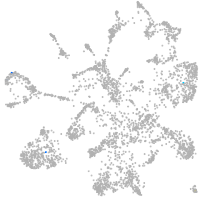
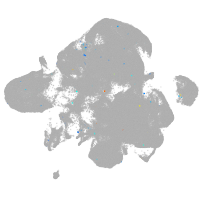
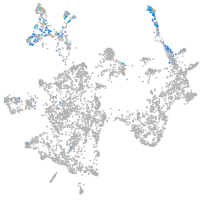
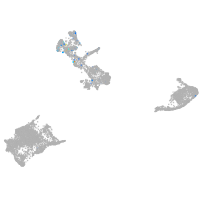
Correlated gene expression
Positive correlation
Negative correlation
Gene
r
Gene
r
si:dkey-88n24.12
0.550
marcksl1a
-0.222
si:dkeyp-69c1.9
0.547
si:ch211-222l21.1
-0.199
odf3b
0.527
rpl18
-0.178
tbata
0.519
rpl19
-0.176
zgc:195356
0.515
rps13
-0.169
si:ch211-250c4.5
0.500
rpl13a
-0.168
crocc2
0.493
rpl39
-0.167
gb:eh456644
0.480
rpl7a
-0.166
c8h22orf15
0.479
alcamb
-0.166
zmynd12
0.468
faua
-0.163
si:ch211-163l21.7
0.466
rpl35
-0.163
ccdc153
0.464
rps25
-0.162
si:dkey-11c5.11
0.463
rplp1
-0.160
zgc:55461
0.455
eef1a1l1
-0.157
cfap157
0.454
rpl23
-0.157
si:ch211-197n1.2
0.453
tox
-0.156
ccdc169
0.449
rps12
-0.155
si:dkey-148f10.4
0.444
rpl32
-0.154
LOC100329490
0.443
fabp3
-0.153
dnah5l
0.443
hmgn6
-0.151
CR407547.1
0.441
rps27a
-0.151
si:dkey-30e9.6
0.436
rpl21
-0.150
zgc:158260
0.433
rpsa
-0.150
foxj1a
0.432
rps26
-0.150
si:ch211-155m12.5
0.425
rps15
-0.150
tekt1
0.423
rps15a
-0.149
capsla
0.417
rpl11
-0.148
hsbp1l1
0.415
hmgn2
-0.148
paqr5b
0.412
rpl10
-0.148
enkur
0.411
rpl17
-0.148
zgc:112416
0.410
gng13a
-0.147
zgc:92275
0.406
si:dkey-151g10.6
-0.145
tekt2
0.405
hnrnpa0l
-0.144
ccdc17
0.399
prox1a
-0.144
meig1
0.396
marcksl1b
-0.143