Daniocell
slc25a15a (taste / olfactory)
solute carrier family 25 member 15a
ZFIN
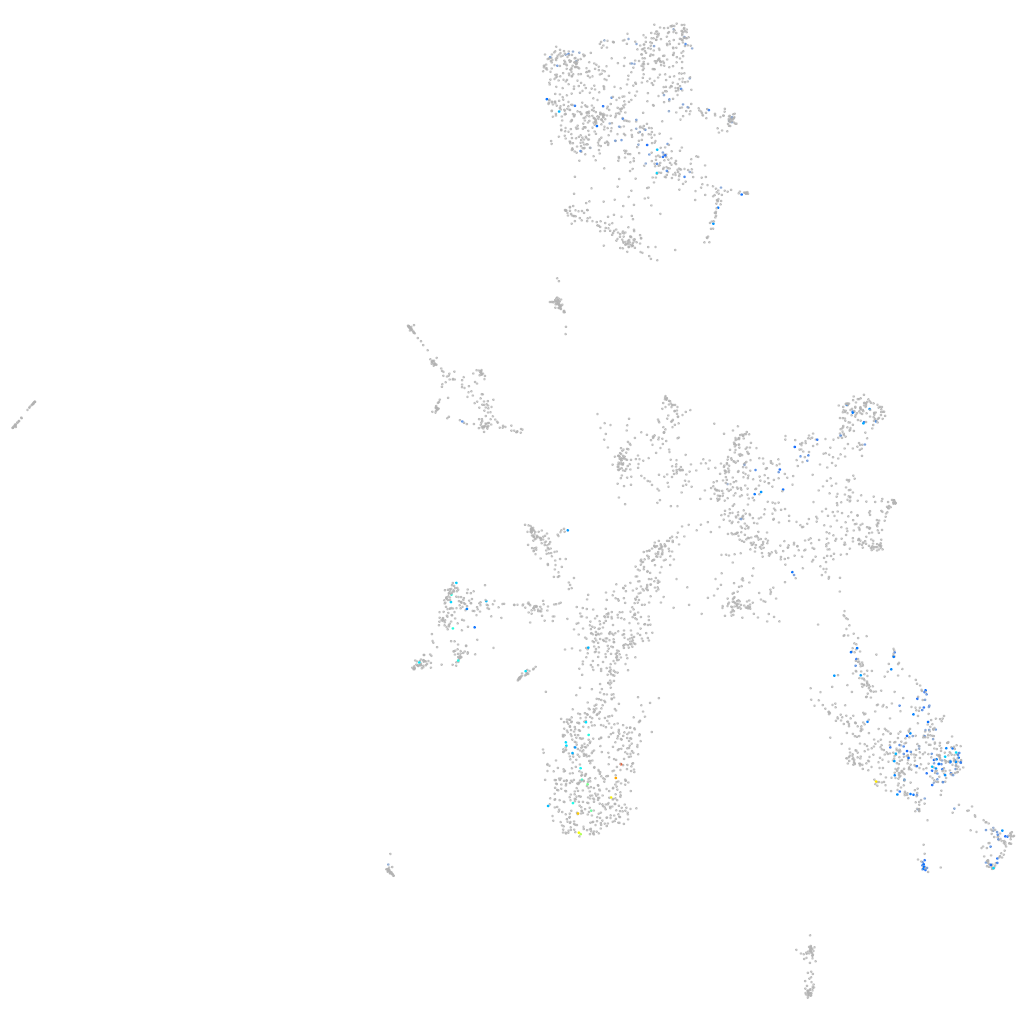
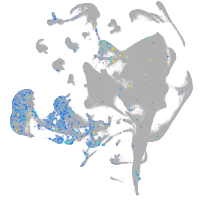
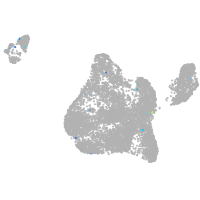
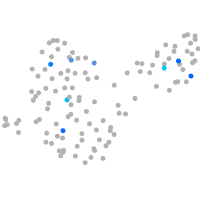
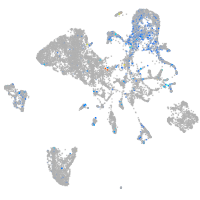
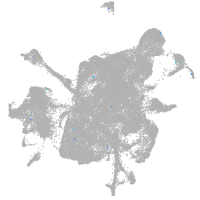
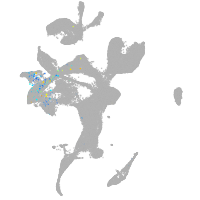
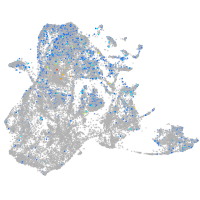
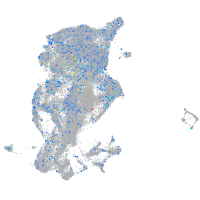
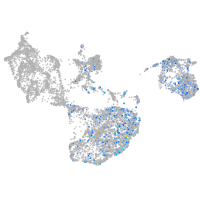
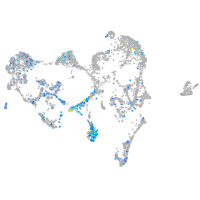
Gene expression UMAP
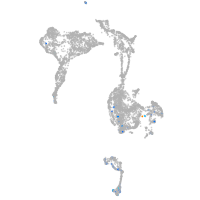
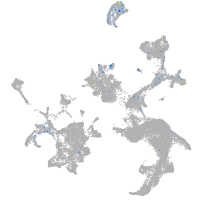
Display:
Expression
Stage
Other cell groups
all cells
blastomeres
PGCs
endoderm
axial mesoderm
muscle
mural cells /
non-skeletal muscle
mesenchyme
hematopoietic /
vasculature
pronephros
neural
spinal cord / glia
eye
taste / olfactory
otic / lateral line
epidermis
periderm
fin
ionocytes / mucous
pigment cells
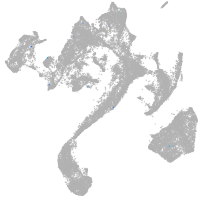
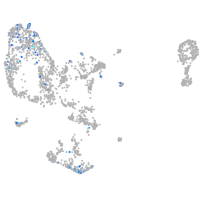
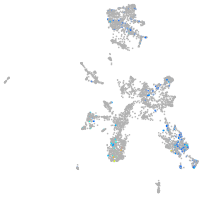
Expression by stage/cluster
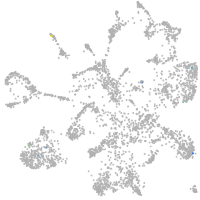
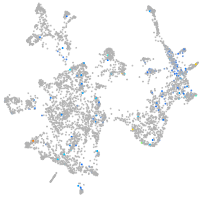
Correlated gene expression
Positive correlation
Negative correlation
Gene
r
Gene
r
LOC100334341
0.267
marcksl1a
-0.095
LOC108183933
0.210
si:ch211-222l21.1
-0.084
XLOC-016511
0.208
hmga1a
-0.079
si:ch211-142c4.1
0.192
rps23
-0.077
si:ch211-286b4.4
0.185
hmgb3a
-0.077
cyp24a1
0.171
marcksl1b
-0.075
sult2st1
0.161
rps21
-0.074
si:dkey-35h6.1
0.159
ptmab
-0.072
il4
0.154
cdkn1ca
-0.072
BX255944.1
0.153
si:ch73-1a9.3
-0.072
BX530079.1
0.153
chd4a
-0.070
CABZ01084566.1
0.152
hnrnpaba
-0.069
wu:fj16a03
0.151
si:dkey-56m19.5
-0.067
selenow2b
0.147
mdka
-0.066
gcnt7
0.147
sox11a
-0.065
si:dkey-71b5.7
0.146
hmgb1a
-0.064
BX511073.1
0.146
rpl30
-0.063
fabp10b
0.145
tubb5
-0.063
BX649282.2
0.145
cited4b
-0.063
zgc:123244
0.144
h2afvb
-0.063
moxd1l
0.143
tuba8l3
-0.062
nrsn1
0.142
smarce1
-0.061
bcat1
0.142
tubb2b
-0.061
htatip2
0.141
snrpf
-0.061
cyp3c1
0.138
dlb
-0.060
TSTD1
0.138
cirbpb
-0.060
nqo1
0.137
hdac1
-0.060
slc8a4a
0.136
rps12
-0.059
si:dkeyp-86h10.3
0.135
hsp90ab1
-0.059
si:ch211-153b23.5
0.134
CABZ01072614.1
-0.059
si:dkey-256h2.1
0.134
cct2
-0.058
gstp1
0.132
rps29
-0.058
dnali1
0.132
cirbpa
-0.057
si:dkey-34d22.5
0.131
rcc2
-0.057
elf3
0.130
ewsr1a
-0.056