Daniocell
sipa1l1 (periderm)
signal-induced proliferation-associated 1 like 1
ZFIN
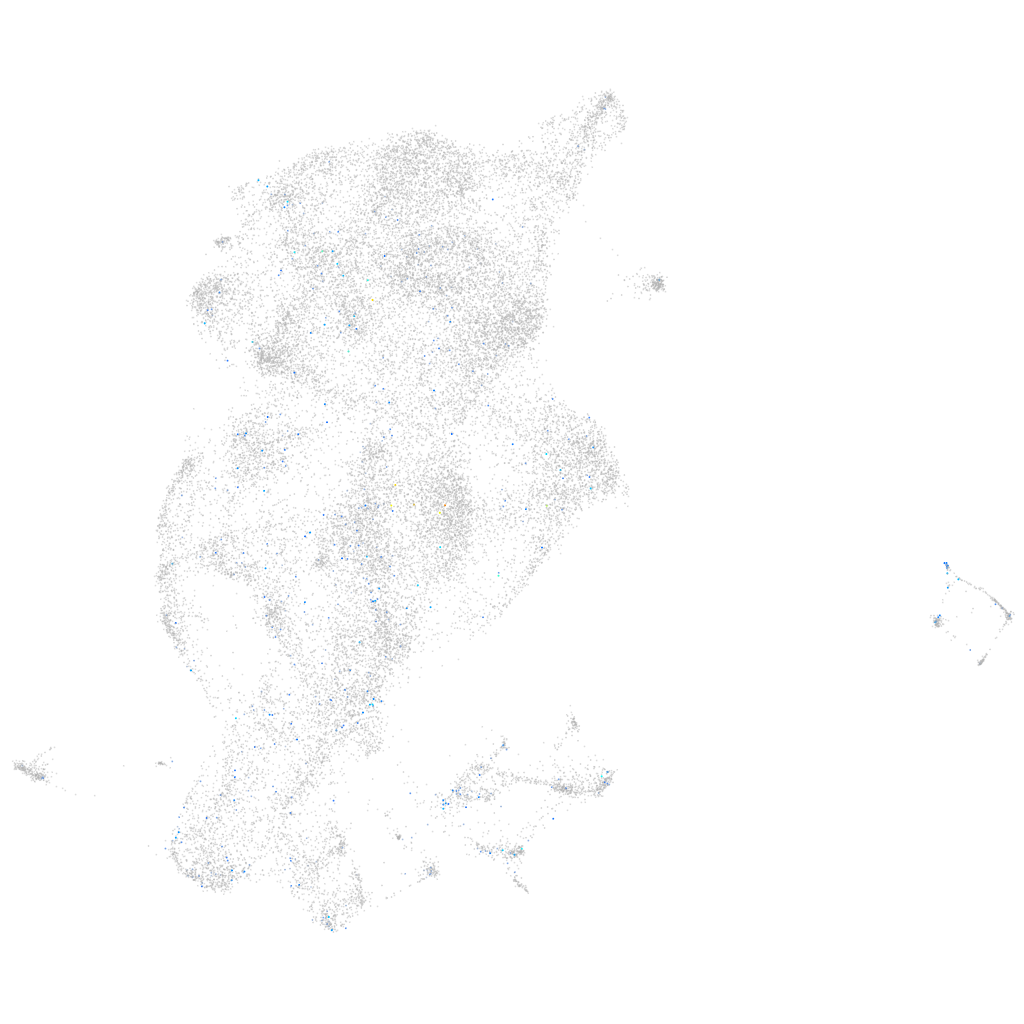
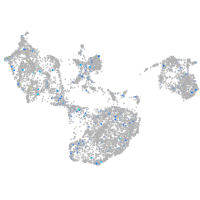
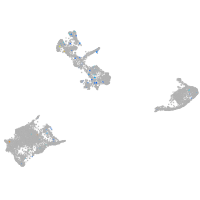
Gene expression UMAP
Display:
Expression
Stage
Other cell groups
all cells
blastomeres
PGCs
endoderm
axial mesoderm
muscle
mural cells /
non-skeletal muscle
mesenchyme
hematopoietic /
vasculature
pronephros
neural
spinal cord / glia
eye
taste / olfactory
otic / lateral line
epidermis
periderm
fin
ionocytes / mucous
pigment cells
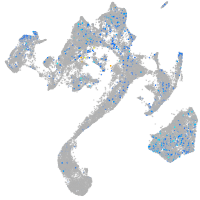
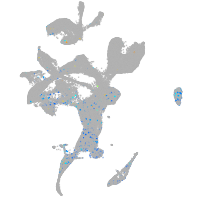
Expression by stage/cluster
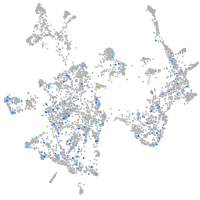
Correlated gene expression
Positive correlation
Negative correlation
Gene
r
Gene
r
si:ch211-89o9.4
0.159
cyt1
-0.058
si:ch211-215m21.22
0.140
si:ch211-195b11.3
-0.048
CR925804.1
0.131
rplp1
-0.048
LOC100535286
0.115
rps10
-0.047
BX255897.1
0.111
rplp0
-0.046
cyp11a1
0.109
anxa1a
-0.045
adamts17
0.100
rps23
-0.045
LOC108190928
0.097
selenow1
-0.044
zgc:171220
0.092
rpl39
-0.043
CR559945.1
0.092
rpl8
-0.043
pde6b
0.084
faua
-0.043
FO834825.1
0.082
rps24
-0.042
vipr1b
0.082
icn2
-0.041
tatdn2
0.082
rpl28
-0.041
LOC110440031
0.081
rpl21
-0.041
LOC110437817
0.081
krt4
-0.040
CT025909.1
0.081
rpl37
-0.040
BX005229.1
0.081
krt17
-0.040
crygn1
0.080
zgc:114188
-0.040
CR790368.1
0.079
rps27a
-0.039
si:rp71-45k5.2
0.079
rps11
-0.039
c3a.5
0.077
rps7
-0.039
LOC110438186
0.077
rpl22
-0.039
si:dkey-106c17.2.1
0.077
rps4x
-0.039
CABZ01066611.1
0.077
rpl26
-0.038
BX927394.1
0.076
wu:fb18f06
-0.038
klhl14
0.076
cyt1l
-0.038
XLOC-020174
0.075
rpl7
-0.038
cth1
0.075
rps29
-0.038
LOC110439636
0.075
rps27.1
-0.037
zgc:66483
0.075
rps21
-0.036
LOC101884122
0.074
rpl35
-0.036
BX322665.2
0.074
zgc:193505
-0.036
col4a2
0.073
rpl19
-0.035
asz1
0.073
rpl10a
-0.035