Daniocell
sik3 (blastomeres)
SIK family kinase 3
ZFIN
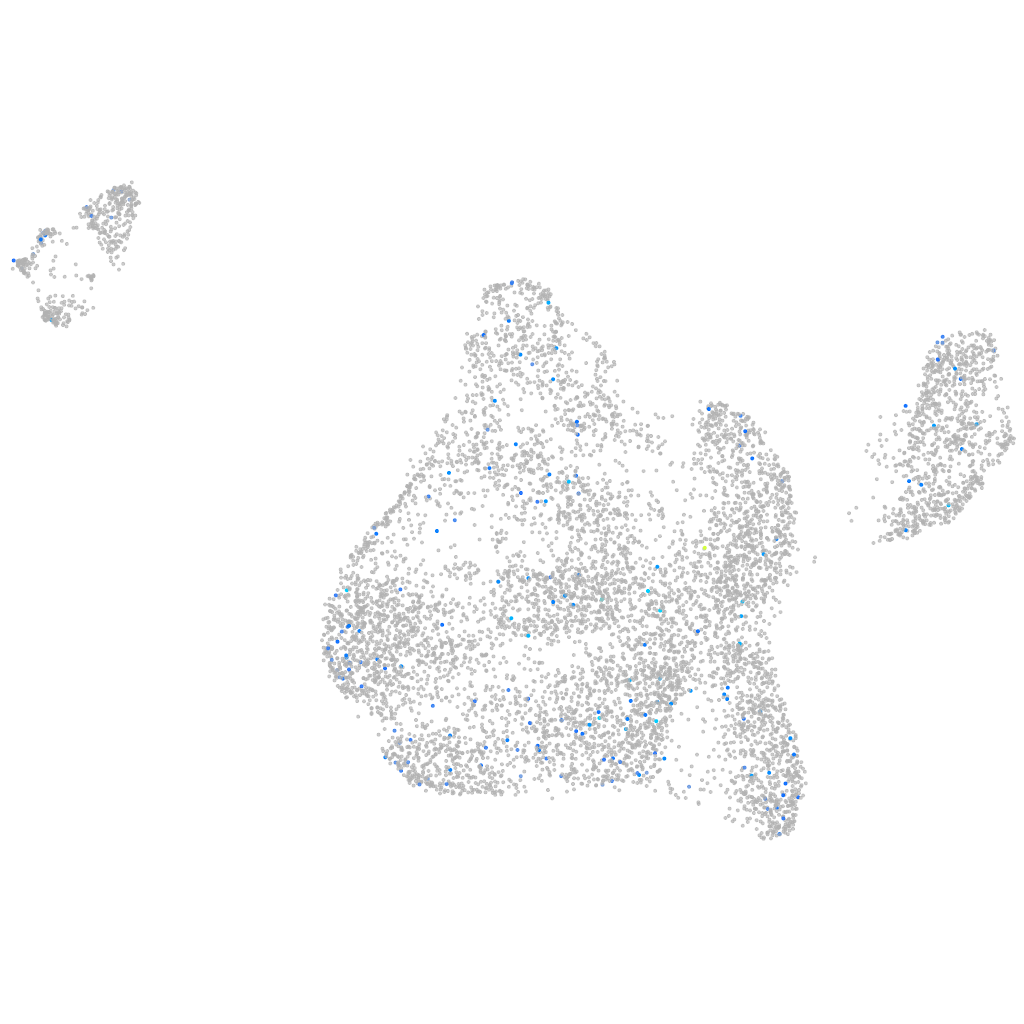
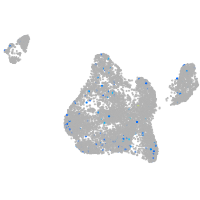
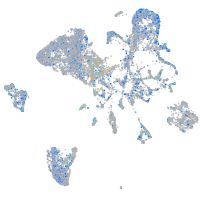
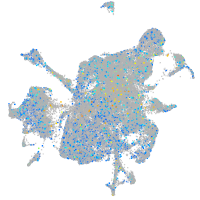
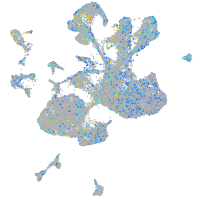
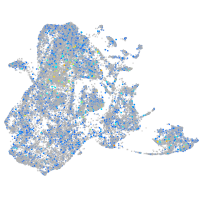
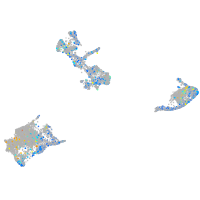
Gene expression UMAP
Display:
Expression
Stage
Other cell groups
all cells
blastomeres
PGCs
endoderm
axial mesoderm
muscle
mural cells /
non-skeletal muscle
mesenchyme
hematopoietic /
vasculature
pronephros
neural
spinal cord / glia
eye
taste / olfactory
otic / lateral line
epidermis
periderm
fin
ionocytes / mucous
pigment cells
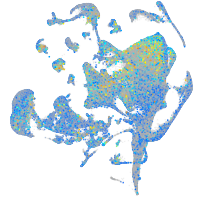
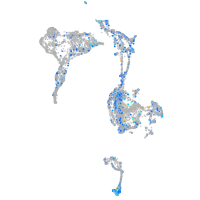
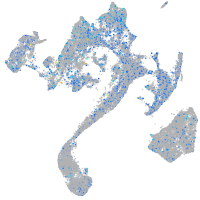
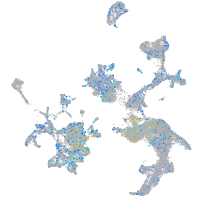
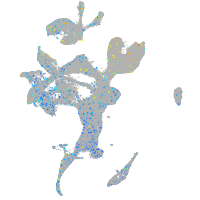
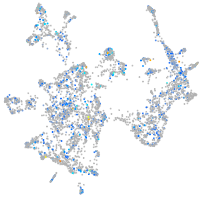
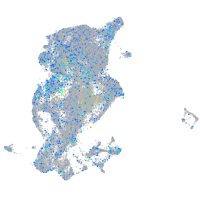
Expression by stage/cluster
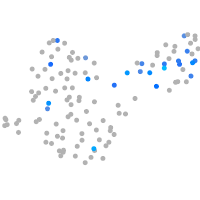
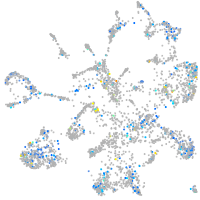
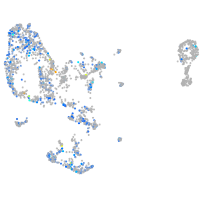
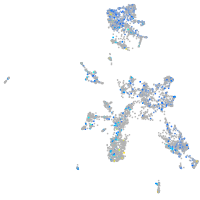
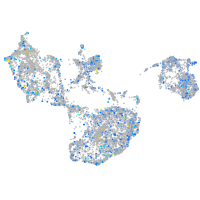
Correlated gene expression
Positive correlation
Negative correlation
Gene
r
Gene
r
XLOC-031339
0.166
ucp2
-0.038
LOC103910988
0.129
sec61b
-0.035
CABZ01079179.1
0.124
p4hb
-0.035
LOC110438013
0.119
cfl1l
-0.033
XLOC-014827
0.119
sf3b5
-0.030
npy
0.116
cdk9
-0.030
rilpl1
0.115
dctpp1
-0.029
CT573383.1
0.113
atp5meb
-0.028
foxo1a
0.106
rbm7
-0.028
hhatla
0.104
fam177a1
-0.027
LOC103911261
0.101
tmem214
-0.027
zgc:92590
0.098
zgc:55461
-0.027
CT573787.1
0.097
rpl12
-0.027
wdr17
0.097
mfap1
-0.026
rims4
0.097
itm2cb
-0.026
si:ch211-232m10.6
0.094
lmnb1
-0.026
aadacl4
0.093
rhocb
-0.025
marveld1
0.091
ifrd1
-0.025
lrrc74a
0.090
rpia
-0.025
st6galnac6
0.090
nkap
-0.025
CU657980.1
0.089
CABZ01081730.1
-0.024
BX890559.1
0.088
zgc:77650
-0.024
slc16a1a
0.087
psme3
-0.024
XLOC-000086
0.086
f11r.1
-0.024
ntng2a
0.086
ppp1r2
-0.024
LOC103911885
0.084
CABZ01074453.1
-0.024
si:ch1073-59l16.1
0.084
hmbsb
-0.024
aqp10a
0.082
lclat1
-0.024
XLOC-037221
0.082
impdh2
-0.024
BX001026.1
0.081
jpt1b
-0.024
zgc:92040
0.079
ube2l3a
-0.024
XLOC-005677
0.079
dnajc14
-0.024
XLOC-036261
0.078
si:dkey-38p12.3
-0.024
LOC108190180
0.078
appbp2
-0.024
BX908800.1
0.078
pttg1
-0.024