Daniocell
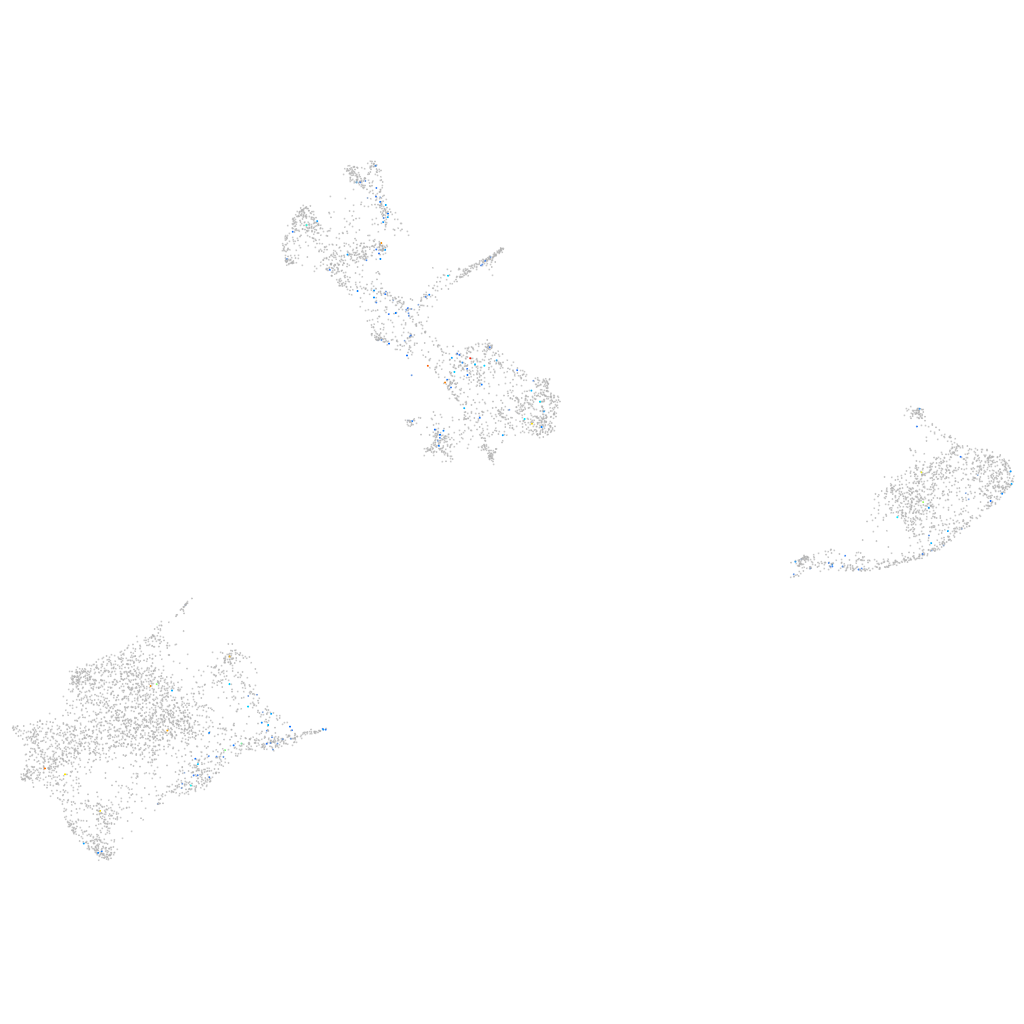
si:dkey-9c18.3 (pigment cells)
si:dkey-9c18.3
ZFIN
Gene expression UMAP
Display:
Expression
Stage
Other cell groups
all cells
blastomeres
PGCs
endoderm
axial mesoderm
muscle
mural cells /
non-skeletal muscle
mesenchyme
hematopoietic /
vasculature
pronephros
neural
spinal cord / glia
eye
taste / olfactory
otic / lateral line
epidermis
periderm
fin
ionocytes / mucous
pigment cells
Expression by stage/cluster
Correlated gene expression
Positive correlation
Negative correlation
Gene
r
Gene
r
si:ch211-214c7.5
0.208
uraha
-0.049
LOC100536746
0.198
gstp1
-0.048
znf1147
0.174
zgc:110339
-0.048
si:ch211-113a14.19
0.158
actb2
-0.044
XLOC-007520
0.153
hbae3
-0.044
ccr10
0.153
si:dkey-251i10.2
-0.040
pax9
0.129
mylpfa
-0.039
si:ch211-258f14.2
0.126
gch2
-0.036
LOC100535070
0.122
pvalb2
-0.035
foxred1
0.118
tnni2a.4
-0.034
BX510960.2
0.116
CABZ01021592.1
-0.034
adck2
0.115
nupr1a
-0.033
LOC101886905
0.115
csrp2
-0.031
BX548024.1
0.110
crabp2b
-0.031
b4galnt3b
0.110
prss1
-0.030
vtg6
0.108
oaz2a
-0.030
si:dkey-25i10.1
0.107
ckma
-0.030
pkd1l2b
0.106
aldh1l1
-0.030
kiss1ra
0.105
cyt1l
-0.029
cacnb2b
0.104
hbae1.1
-0.029
CABZ01081908.1
0.103
icn
-0.029
bard1
0.103
tmem130
-0.029
CU595864.1
0.102
oxr1b
-0.028
CU499330.1
0.102
slc22a7a
-0.028
erich3
0.101
prdx5
-0.027
esyt2b
0.100
pfn1
-0.027
entpd3
0.098
ttn.2
-0.027
aknad1
0.098
zgc:153031
-0.027
ch25hl2
0.096
pvalb1
-0.026
si:dkeyp-117h8.4
0.094
krt4
-0.026
CCKBR
0.093
s100a10b
-0.026
antxr1b
0.092
actc1b
-0.025
nt5c1ab
0.090
icn2
-0.025
XLOC-013632
0.088
hbbe1.3
-0.025
si:dkey-34m19.3
0.088
rbp4l
-0.024