Daniocell
si:dkey-9c18.3 (axial mesoderm)
si:dkey-9c18.3
ZFIN
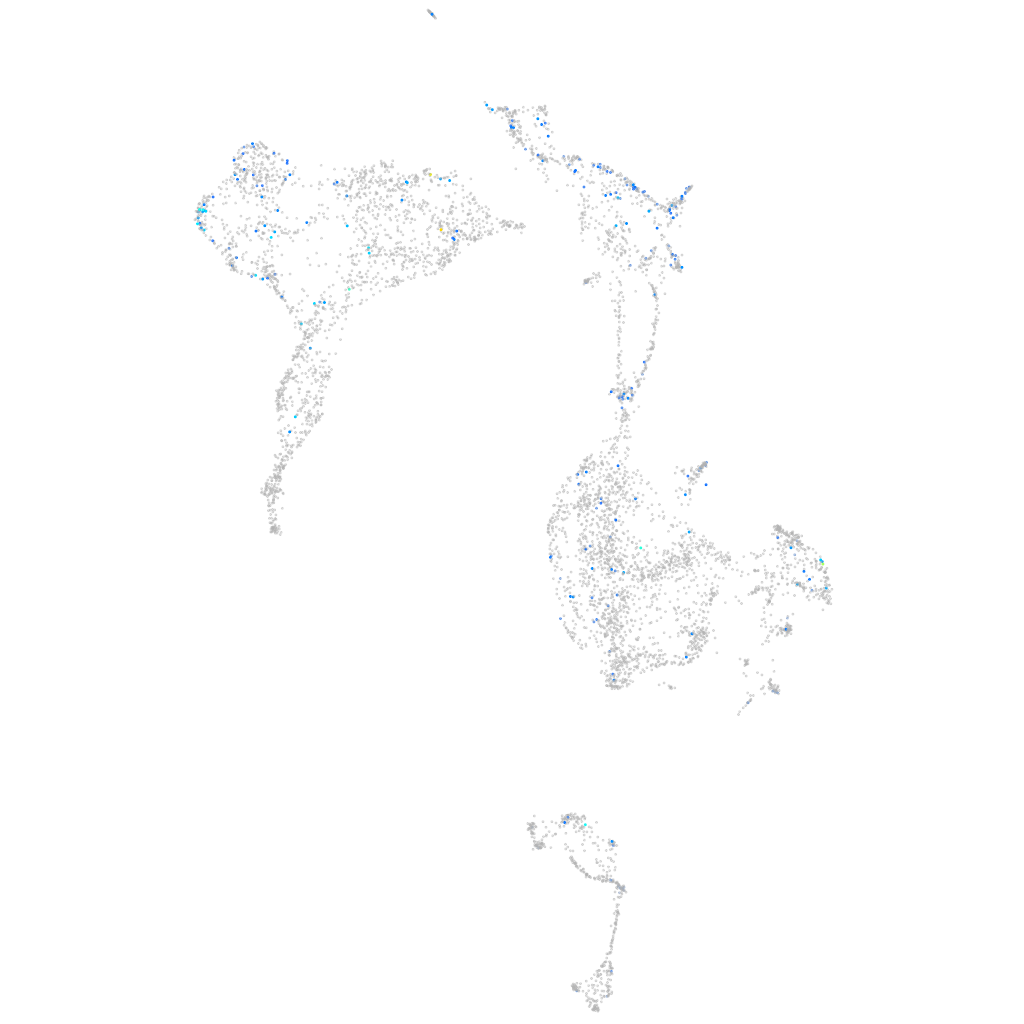
Gene expression UMAP
Display:
Expression
Stage
Other cell groups
all cells
blastomeres
PGCs
endoderm
axial mesoderm
muscle
mural cells /
non-skeletal muscle
mesenchyme
hematopoietic /
vasculature
pronephros
neural
spinal cord / glia
eye
taste / olfactory
otic / lateral line
epidermis
periderm
fin
ionocytes / mucous
pigment cells
Expression by stage/cluster
Correlated gene expression
Positive correlation
Negative correlation
Gene
r
Gene
r
BX324164.5
0.185
rplp2
-0.081
CU929150.2
0.179
krt8
-0.075
LOC100334104
0.174
rplp1
-0.072
BX908804.1
0.164
rps29
-0.067
CABZ01101813.1
0.136
rplp2l
-0.065
XLOC-031035
0.134
matn3a
-0.064
si:ch211-133n4.9
0.132
epyc
-0.063
LOC101882480
0.124
krt5
-0.062
LOC101886451
0.124
col11a2
-0.061
rab32a
0.122
krt18a.1
-0.061
LOC103910369
0.118
ucmab
-0.060
zgc:100951
0.117
rpl35a
-0.058
si:ch73-379f7.5
0.113
rpl36
-0.058
LO017955.1
0.111
rpl31
-0.057
BX323880.1
0.111
zgc:113232
-0.055
rnasel4
0.110
si:ch211-243g18.2
-0.055
CR762400.1
0.108
si:dkey-31g6.6
-0.055
traj5
0.108
chad
-0.055
CABZ01033206.1
0.107
si:ch73-23l24.1
-0.054
gja8a
0.107
rpl3
-0.054
si:ch211-114l13.1
0.107
rps24
-0.054
bzw1b
0.107
si:dkey-151g10.6
-0.052
slc16a3
0.106
uba52
-0.052
gdf3
0.106
rpl14
-0.052
dctpp1
0.105
pleca
-0.052
FO904898.4
0.104
zgc:158463
-0.051
otol1b
0.103
rpl39
-0.051
evi5a
0.103
rpl27
-0.051
si:dkey-68o6.5
0.102
rps26l
-0.050
CT030188.1
0.102
nid1a
-0.050
faub
0.101
krt91
-0.049
h1m
0.101
si:dkey-1j5.4
-0.049
has2
0.101
rpl29
-0.049
gtf2a1
0.101
rgcc
-0.049
nanog
0.100
rps21
-0.048