Daniocell
si:dkey-40c11.2 (periderm)
si:dkey-40c11.2
ZFIN
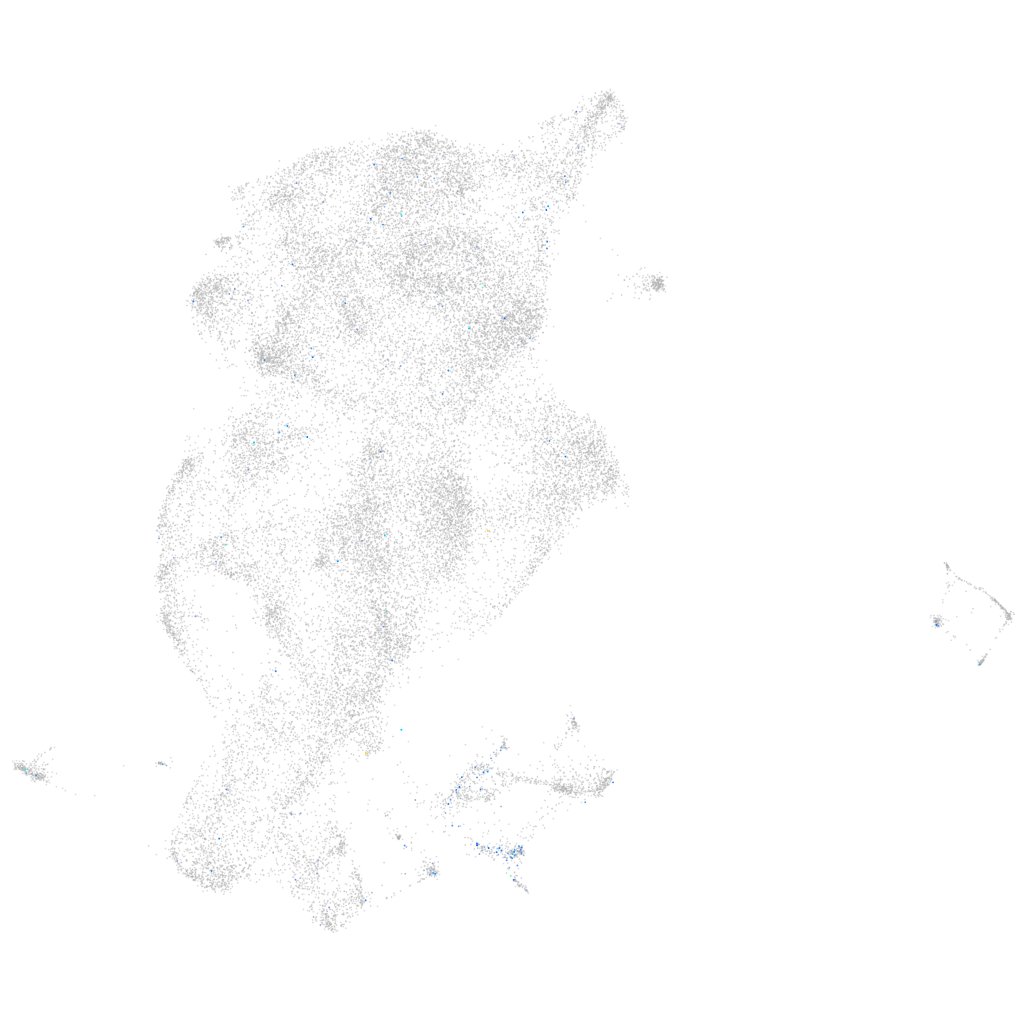
Gene expression UMAP
Display:
Expression
Stage
Other cell groups
all cells
blastomeres
PGCs
endoderm
axial mesoderm
muscle
mural cells /
non-skeletal muscle
mesenchyme
hematopoietic /
vasculature
pronephros
neural
spinal cord / glia
eye
taste / olfactory
otic / lateral line
epidermis
periderm
fin
ionocytes / mucous
pigment cells
Expression by stage/cluster
Correlated gene expression
Positive correlation
Negative correlation
Gene
r
Gene
r
gpr174
0.158
zgc:193505
-0.029
wdr95
0.157
tcima
-0.027
LOC110437760
0.147
si:ch211-195b11.3
-0.027
CABZ01050944.1
0.146
krt4
-0.026
reln
0.143
wu:fb18f06
-0.024
BX649499.1
0.140
cfl1l
-0.024
CU855895.2
0.123
cyt1
-0.023
LOC108183430
0.117
si:ch211-125o16.4
-0.023
anos1b
0.116
lye
-0.022
AL954703.1
0.115
anxa1c
-0.022
dpyda.3
0.114
capns1b
-0.020
pmp22a
0.112
icn2
-0.020
col5a1
0.111
ca2
-0.020
twist1a
0.109
gsta.1
-0.019
col5a2a
0.104
si:dkey-16l2.20
-0.018
si:ch211-256e16.4
0.102
si:ch211-202f5.3
-0.018
LOC100334612
0.101
tob1b
-0.018
cilp
0.101
nqo1
-0.018
emilin1b
0.100
pnp5a
-0.018
sfrp2
0.100
si:ch211-157c3.4
-0.018
si:dkey-87k14.1
0.098
agr1
-0.017
tgfbi
0.097
selenow2b
-0.017
tmem119b
0.096
CABZ01068469.1
-0.016
si:ch1073-459j12.1
0.095
ppl
-0.016
sparc
0.094
icn
-0.016
LOC100332973
0.094
cox5ab
-0.016
si:ch211-43f4.1
0.093
tmem176l.4
-0.016
mamdc2a
0.093
cyp17a1
-0.016
tnn
0.091
serpinb1l3
-0.015
col1a2
0.091
rpl14
-0.015
XLOC-023380
0.091
dhrs13l1
-0.015
mfap2
0.091
si:ch73-52f15.5
-0.015
col6a4a
0.089
impa1
-0.015
jam2b
0.088
gmds
-0.015
BX004981.2
0.088
mgst2
-0.015