Daniocell
si:dkey-34e4.1 (pigment cells)
si:dkey-34e4.1
ZFIN
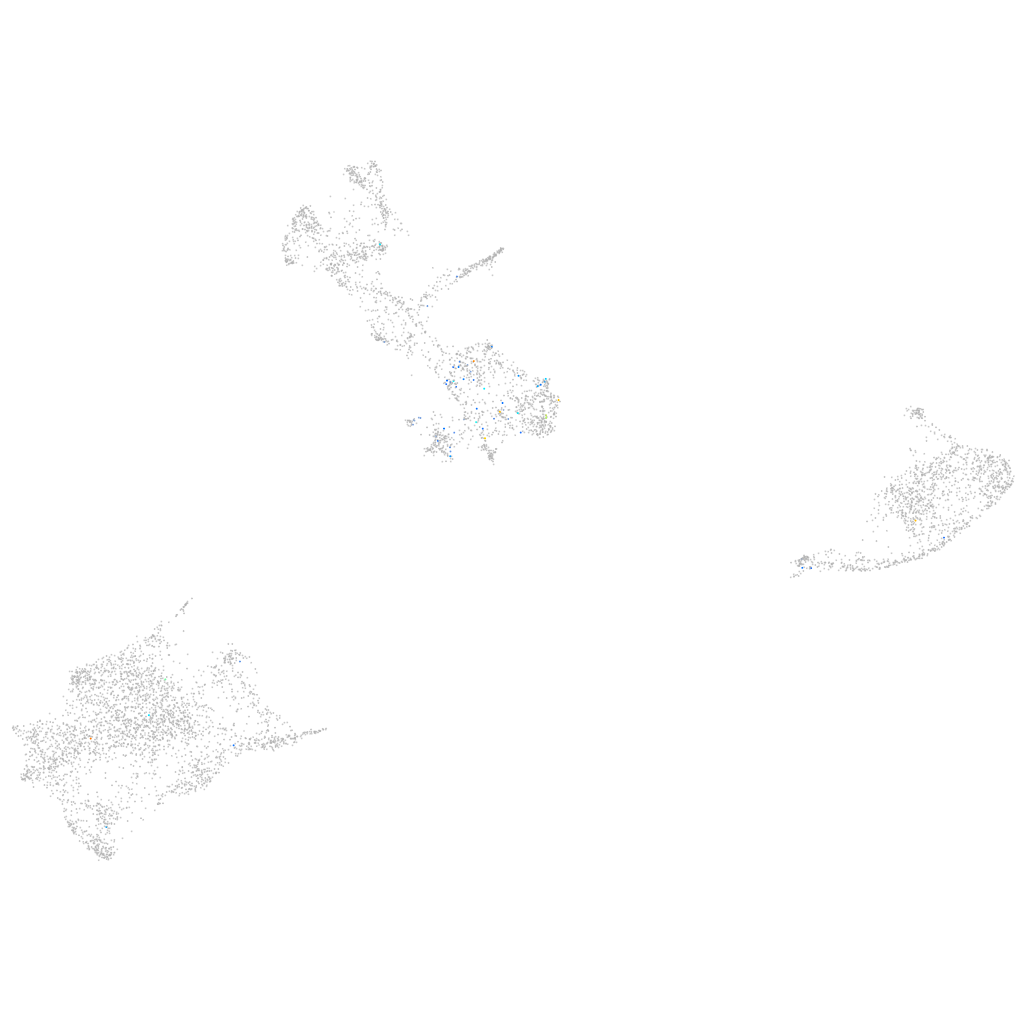
Gene expression UMAP
Display:
Expression
Stage
Other cell groups
all cells
blastomeres
PGCs
endoderm
axial mesoderm
muscle
mural cells /
non-skeletal muscle
mesenchyme
hematopoietic /
vasculature
pronephros
neural
spinal cord / glia
eye
taste / olfactory
otic / lateral line
epidermis
periderm
fin
ionocytes / mucous
pigment cells
Expression by stage/cluster
Correlated gene expression
Positive correlation
Negative correlation
Gene
r
Gene
r
cracr2ab
0.275
si:dkey-21a6.5
-0.049
LOC108190355
0.267
pttg1ipb
-0.046
LOC103911664
0.264
actb2
-0.045
LOC103910431
0.251
impdh1b
-0.043
CU394253.1
0.245
tspan36
-0.043
XLOC-037556
0.242
LOC103910009
-0.040
BX511311.3
0.231
gmps
-0.039
si:ch211-14a17.6
0.227
syngr1a
-0.039
sele
0.211
sypl2b
-0.037
si:ch211-106j21.2
0.211
tmem130
-0.037
LOC110439582
0.210
elovl1b
-0.036
XLOC-030902
0.208
gstp1
-0.036
XLOC-044035
0.204
smim29
-0.036
CR854907.1
0.199
rnaseka
-0.036
si:ch211-57f7.7
0.176
glulb
-0.036
cyb561
0.175
pts
-0.036
LOC101882231
0.170
zgc:110591
-0.035
ompa
0.168
reep5
-0.035
cfap99
0.168
akr1b1
-0.034
LOC110439826
0.168
rabl6b
-0.034
XLOC-005448
0.167
aldh9a1a.1
-0.034
lzts1
0.164
zgc:110239
-0.034
trim35-33
0.163
rab34b
-0.034
LOC100331412
0.161
paics
-0.034
si:ch73-139j3.4
0.160
pik3c3
-0.034
gpc2
0.160
vps29
-0.034
bnipl
0.154
psph
-0.033
CU627988.1
0.154
rps25
-0.033
XLOC-043229
0.153
cx30.3
-0.033
si:ch211-149a19.3
0.150
prdx6
-0.033
si:ch73-138e16.2
0.148
slc38a5b
-0.032
CR788235.1
0.143
ucp2
-0.032
LOC110438317
0.142
TMEM19
-0.032
rag1
0.138
trpm1b
-0.032
hcrt
0.138
atp11a
-0.032