Daniocell
si:dkey-34e4.1 (hematopoietic / vasculature)
si:dkey-34e4.1
ZFIN
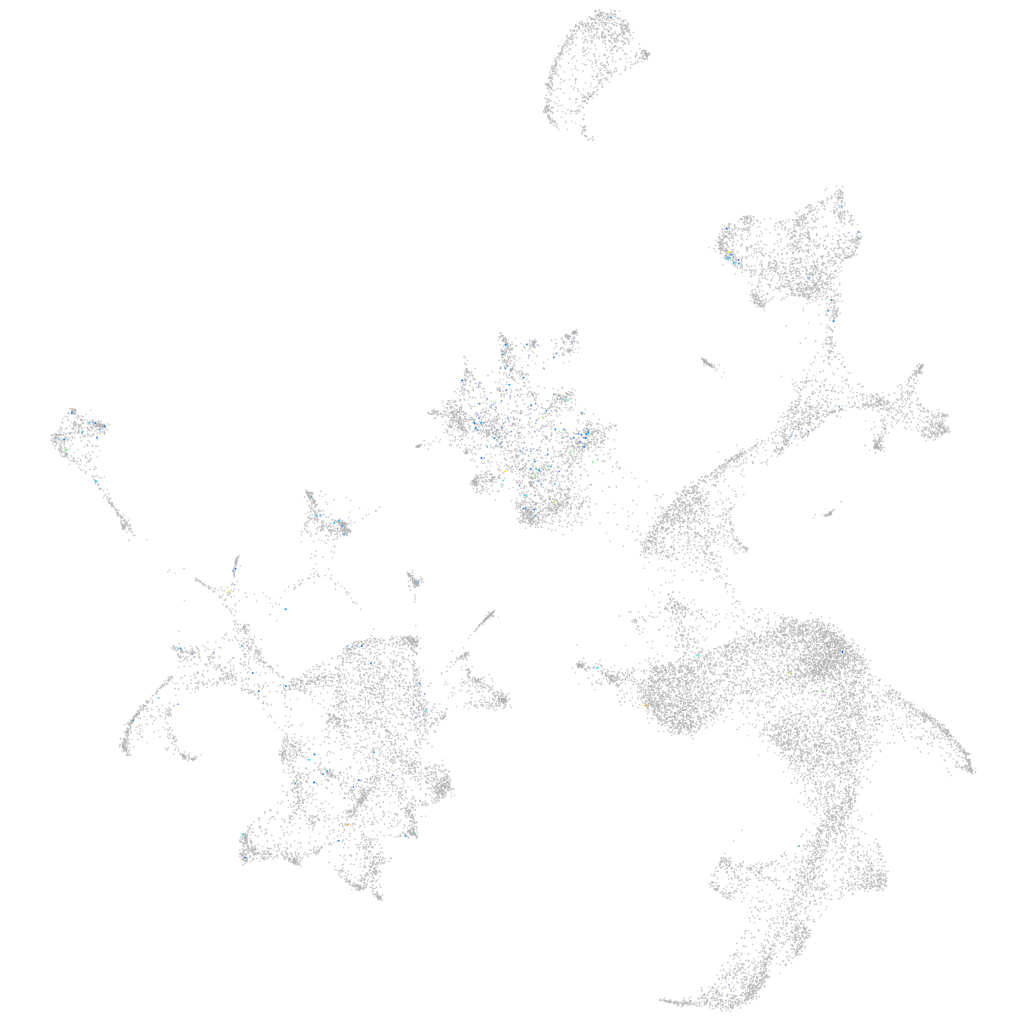
Gene expression UMAP
Display:
Expression
Stage
Other cell groups
all cells
blastomeres
PGCs
endoderm
axial mesoderm
muscle
mural cells /
non-skeletal muscle
mesenchyme
hematopoietic /
vasculature
pronephros
neural
spinal cord / glia
eye
taste / olfactory
otic / lateral line
epidermis
periderm
fin
ionocytes / mucous
pigment cells
Expression by stage/cluster
Correlated gene expression
Positive correlation
Negative correlation
Gene
r
Gene
r
si:dkeyp-79b7.12
0.144
alad
-0.029
FP236457.1
0.138
fam210b
-0.028
mir126b
0.136
hmbsb
-0.027
galnt18a
0.128
tspo
-0.026
CR352228.1
0.116
hmbsa
-0.025
onecut3b
0.116
prdx2
-0.024
rgs9bp
0.110
slc25a37
-0.023
CR936249.1
0.109
tmem14ca
-0.023
AL929396.1
0.105
urod
-0.023
zgc:175136
0.103
alas2
-0.023
BX897682.1
0.098
hbbe3
-0.023
RF00069
0.097
blvrb
-0.023
scrt2
0.097
si:dkey-93h22.7
-0.022
LOC101884182
0.097
vdac2
-0.022
mdkb
0.094
gata1a
-0.022
si:dkey-27n6.4
0.094
impdh2
-0.021
LO018605.3
0.092
hif1al2
-0.021
tmem232
0.092
zgc:163057
-0.021
si:ch211-235m3.10
0.090
slc11a2
-0.021
si:dkey-223d7.6
0.090
tfr1a
-0.021
LOC103911612
0.089
selenoj
-0.020
il12ba
0.088
ppox
-0.020
si:dkey-1h4.4
0.087
arl4aa
-0.020
gpm6aa
0.085
slc4a1a
-0.020
si:ch211-137a8.4
0.084
blf
-0.020
LOC103909513
0.083
hbae5
-0.020
BX470224.2
0.082
txn
-0.020
fdft1
0.082
gp1bb
-0.019
cfap46
0.082
abcb10
-0.019
agbl4
0.082
cldng
-0.019
kcnj1a.2
0.081
cahz
-0.019
nos2b
0.081
tubb1
-0.019
anks1aa
0.081
si:ch73-248e21.7
-0.019
rorb
0.080
epb41b
-0.019
LOC110440047
0.079
klf1
-0.019