Daniocell
si:dkey-253i9.4 (taste / olfactory)
si:dkey-253i9.4
ZFIN
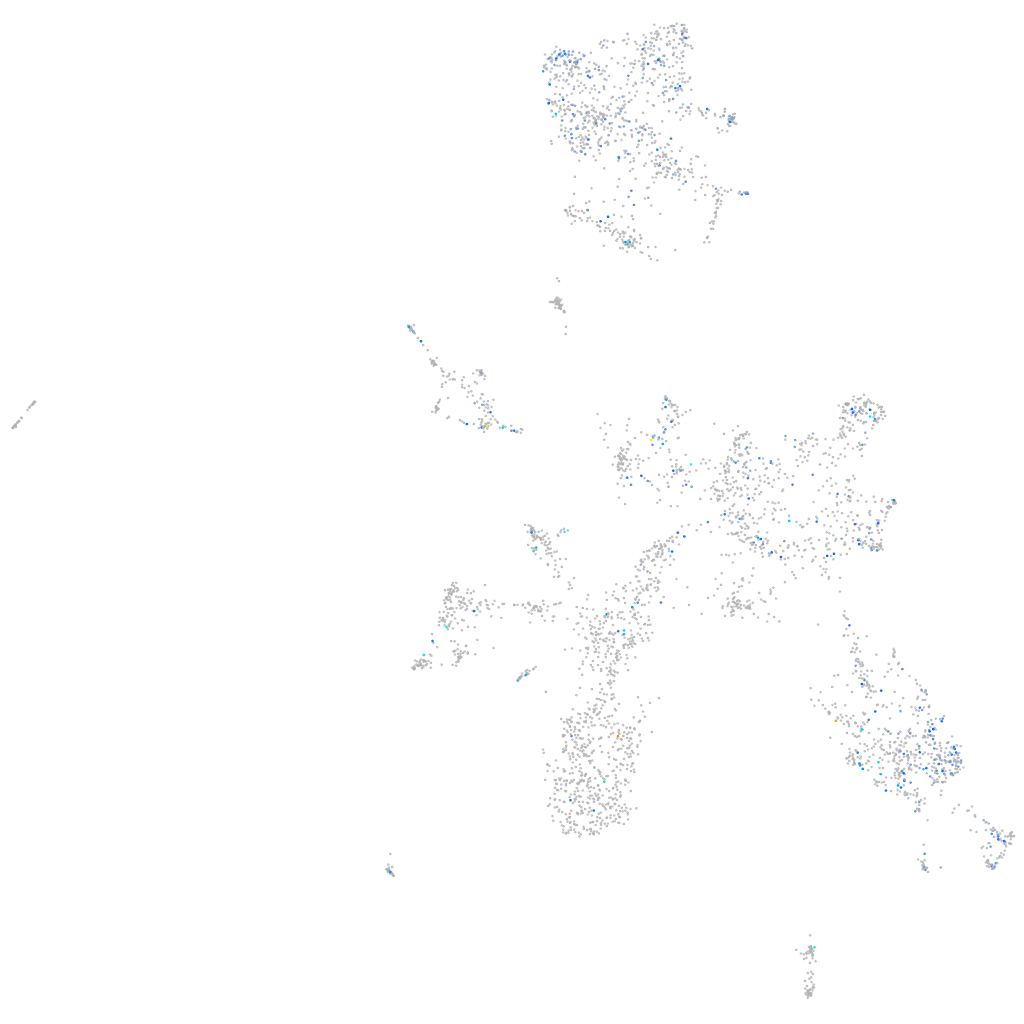
Gene expression UMAP
Display:
Expression
Stage
Other cell groups
all cells
blastomeres
PGCs
endoderm
axial mesoderm
muscle
mural cells /
non-skeletal muscle
mesenchyme
hematopoietic /
vasculature
pronephros
neural
spinal cord / glia
eye
taste / olfactory
otic / lateral line
epidermis
periderm
fin
ionocytes / mucous
pigment cells
Expression by stage/cluster
Correlated gene expression
Positive correlation
Negative correlation
Gene
r
Gene
r
gprc6a
0.182
hbbe1.3
-0.065
sebox
0.166
insm1a
-0.062
XLOC-028466
0.159
hbbe3
-0.060
si:dkey-23i12.9
0.158
zgc:65894
-0.059
LOC110440003
0.156
stmn1b
-0.059
CABZ01085878.1
0.155
rtn1a
-0.059
st3gal4
0.151
si:ch211-10a23.2
-0.058
vcanb
0.149
tmeff1b
-0.056
LOC108180805
0.149
camk2n1a
-0.056
LOC110439590
0.148
LOC100537342
-0.056
CU571384.1
0.147
lhx2a
-0.055
ros1
0.140
ptmaa
-0.054
irx6a
0.140
zgc:153383
-0.054
zdhhc8a
0.139
edil3a
-0.053
prkcg
0.136
si:dkeyp-75h12.5
-0.053
nipsnap1
0.130
tuba1a
-0.053
BX537162.1
0.128
rtn4b
-0.053
grm6b
0.124
tmsb
-0.053
pfkmb
0.121
palm1b
-0.052
XLOC-028954
0.121
si:dkey-280e21.3
-0.051
ccl33.3
0.121
elavl3
-0.051
trnC
0.120
pcgf6
-0.051
LOC110439970
0.119
olfm1b
-0.051
XLOC-002636
0.118
hs3st1l2
-0.050
gsta.1
0.114
atp6v0cb
-0.049
acbd4
0.113
adcyap1b
-0.049
CABZ01027551.1
0.113
sncb
-0.049
zgc:153441
0.112
tuba2
-0.049
si:zfos-323e3.4
0.111
dpysl3
-0.049
LOC103909543
0.110
rnf41l
-0.049
rpp21
0.110
map7d2b
-0.049
LOC103909988
0.109
capslb
-0.048
CU571079.1
0.108
adgrl3.1
-0.048
zgc:173742
0.107
inaa
-0.048
zgc:171977
0.106
myhz1.1
-0.048