Daniocell
si:dkey-253i9.4 (otic / lateral line)
si:dkey-253i9.4
ZFIN
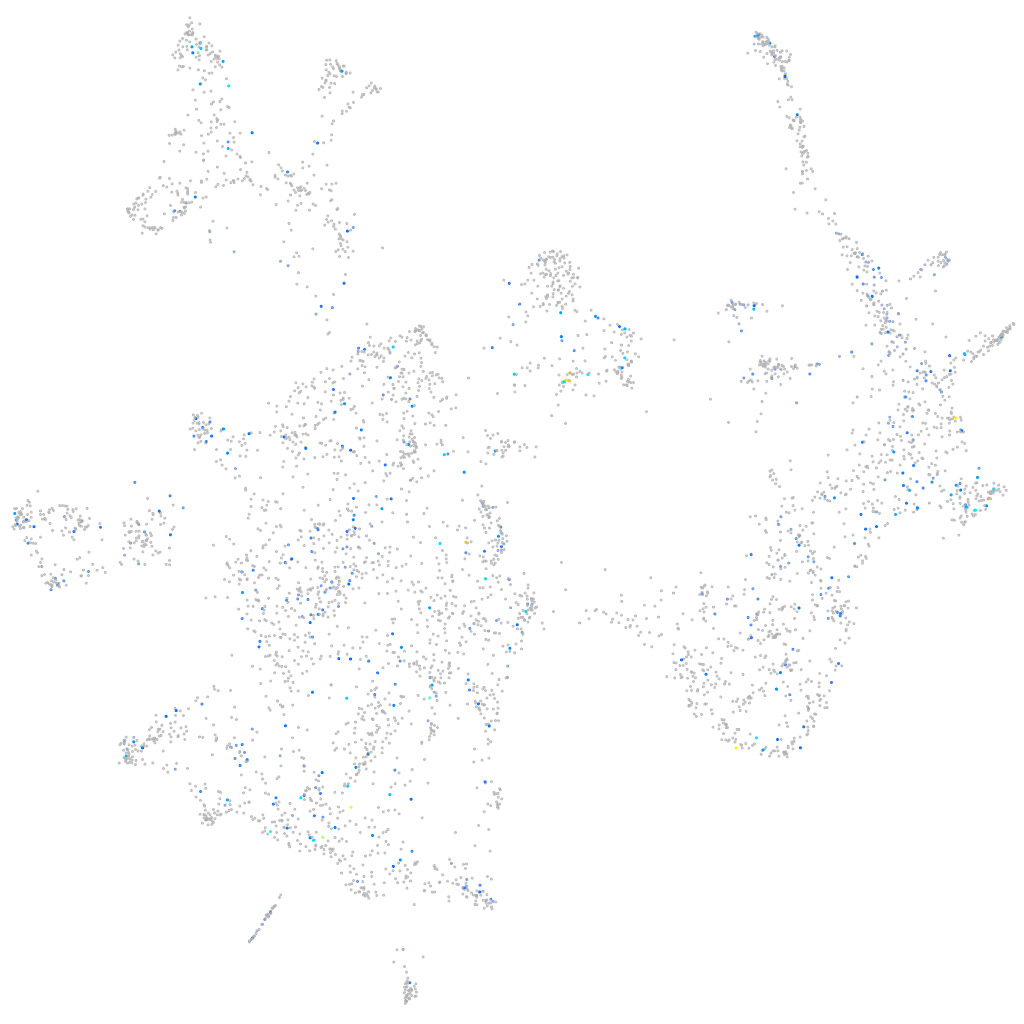
Gene expression UMAP
Display:
Expression
Stage
Other cell groups
all cells
blastomeres
PGCs
endoderm
axial mesoderm
muscle
mural cells /
non-skeletal muscle
mesenchyme
hematopoietic /
vasculature
pronephros
neural
spinal cord / glia
eye
taste / olfactory
otic / lateral line
epidermis
periderm
fin
ionocytes / mucous
pigment cells
Expression by stage/cluster
Correlated gene expression
Positive correlation
Negative correlation
Gene
r
Gene
r
si:ch73-256g18.2
0.167
cox7b
-0.049
snx8b
0.166
erich2
-0.046
trpm1a
0.156
ngfb
-0.042
BX927374.2
0.154
si:ch1073-314i13.4
-0.042
LOC110440222
0.150
emb
-0.042
LOC108182317
0.149
atp8a1
-0.041
samsn1a
0.148
si:ch211-246m6.4
-0.040
nkpd1
0.146
hsp90aa1.2
-0.040
nr1d4a
0.144
senp5
-0.040
prf1.5
0.143
triobpa
-0.040
zgc:162331
0.140
si:dkey-96l17.6
-0.039
cacna1fb
0.140
hddc2
-0.039
si:ch211-276c2.2
0.135
mrps14
-0.038
si:dkeyp-80c12.5
0.134
minos1
-0.037
nectin1a
0.134
twf2b
-0.037
si:ch1073-83n3.2
0.134
pabpc1a
-0.037
CABZ01038709.1
0.134
actc1b
-0.036
ugt5e1
0.134
atxn2
-0.036
mtnr1bb
0.132
sh3gl2a
-0.036
gnb3a
0.131
cbx7a
-0.036
nrn1lb
0.131
ubtfl
-0.036
otx5
0.129
puraa
-0.036
si:ch211-117n7.6
0.125
dync1i2b
-0.035
CU469514.1
0.122
grxcr2
-0.035
lrit1a
0.121
nipa2
-0.035
rs1a
0.119
sb:cb649
-0.035
si:ch211-106h4.9
0.118
mkrn2os.2
-0.035
fgf11a
0.118
si:ch1073-440b2.1
-0.035
si:ch1073-44g3.1
0.115
CU467110.1
-0.035
XLOC-035424
0.113
si:ch211-162e15.3
-0.035
CR385053.2
0.112
kif1aa
-0.035
LOC108179989
0.112
trappc2l
-0.035
BX548032.1
0.111
tmem230a
-0.034
cnrip1b
0.110
ndufa4
-0.034
LOC110440040
0.109
vps26c
-0.034