Daniocell
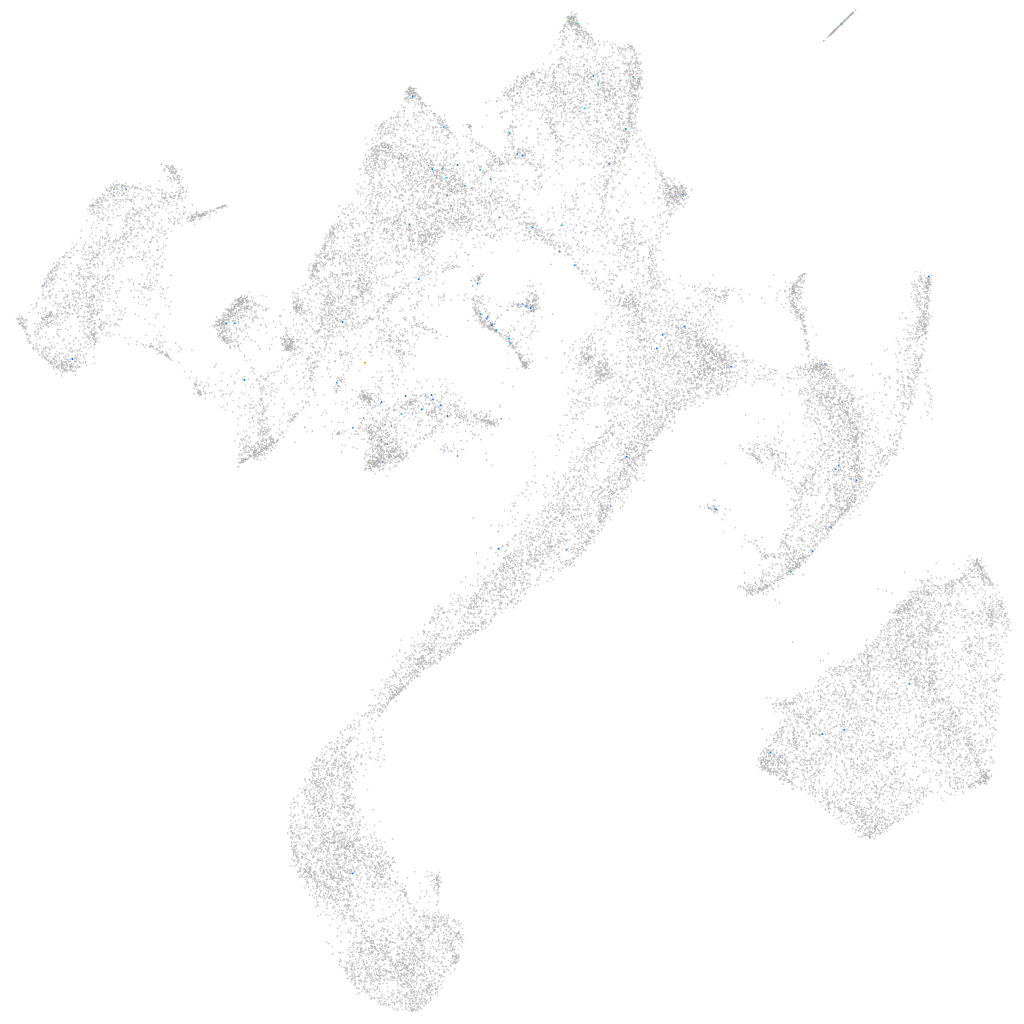
si:dkey-246i14.3 (muscle)
si:dkey-246i14.3
ZFIN
Gene expression UMAP
Display:
Expression
Stage
Other cell groups
all cells
blastomeres
PGCs
endoderm
axial mesoderm
muscle
mural cells /
non-skeletal muscle
mesenchyme
hematopoietic /
vasculature
pronephros
neural
spinal cord / glia
eye
taste / olfactory
otic / lateral line
epidermis
periderm
fin
ionocytes / mucous
pigment cells
Expression by stage/cluster
Correlated gene expression
Positive correlation
Negative correlation
Gene
r
Gene
r
mitfb
0.148
rpl6
-0.026
LOC103911201
0.146
ubap2b
-0.024
XLOC-018654
0.145
hspb1
-0.024
LOC100004033
0.103
rsl1d1
-0.023
LOC100151570
0.101
fxr1
-0.022
kifl
0.097
npm1a
-0.021
si:dkey-261m9.9
0.097
nop10
-0.021
XLOC-039295
0.085
nhp2
-0.020
pcdh2g13
0.085
lyar
-0.020
cdh12a
0.084
ebna1bp2
-0.020
zpld1a
0.084
dkc1
-0.020
BX957260.1
0.074
mybphb
-0.020
LOC108190590
0.073
chchd10
-0.020
syt9b
0.072
rbfox1l
-0.019
BX908744.2
0.070
zgc:92429
-0.019
myo1f
0.069
ndufab1a
-0.019
il11a
0.068
tnnc2
-0.019
CR388413.3
0.068
cycsb
-0.019
si:dkey-246g23.2
0.067
zgc:63882
-0.019
atoh7
0.067
hacd1
-0.018
LOC103909675
0.066
mrps36
-0.018
si:dkey-121h17.7
0.066
hsp90aa1.1
-0.018
LOC103908748
0.064
snu13b
-0.018
LOC100334288
0.064
eif4ebp3l
-0.018
LOC110439590
0.063
dcaf13
-0.018
BX927123.1
0.062
tmem38a
-0.018
LOC110439956
0.062
tmem182a
-0.018
si:ch211-129c21.1
0.061
sh3bgr
-0.018
sh3d21
0.059
CABZ01078594.1
-0.018
CT009596.1
0.058
txn2
-0.018
uts2a
0.057
uqcrh
-0.018
creb3l3b
0.056
fxr2
-0.018
CR318603.1
0.056
desma
-0.018
tmem108
0.055
timm10
-0.018
rassf4a
0.055
emg1
-0.017