Daniocell
si:dkey-229b18.3 (glial cells / spinal cord)
si:dkey-229b18.3
ZFIN
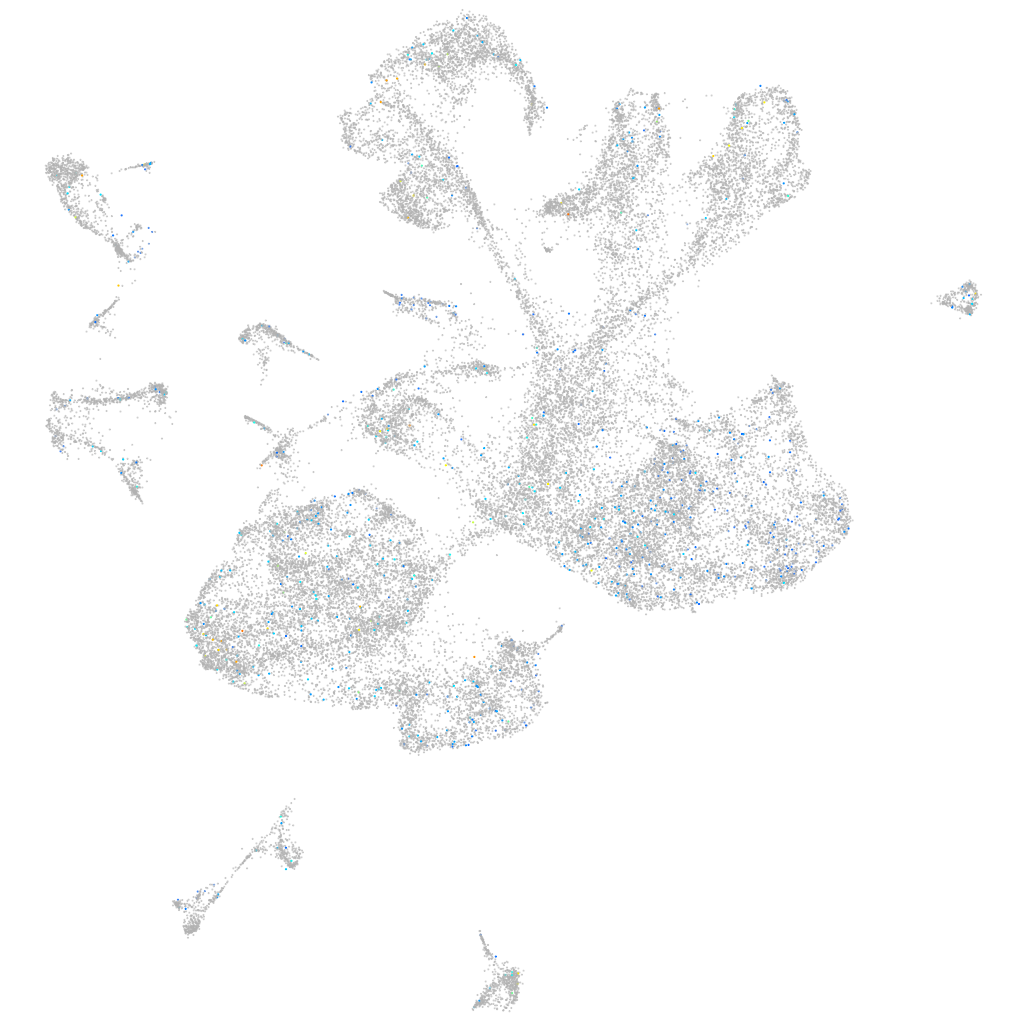
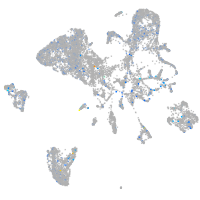
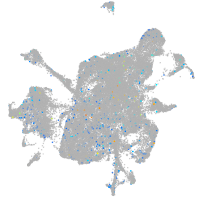
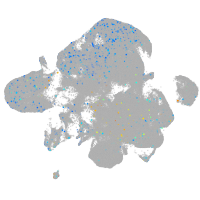
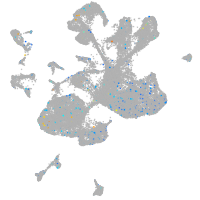
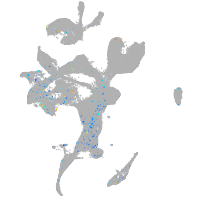
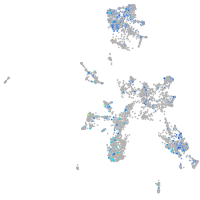
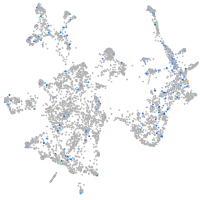
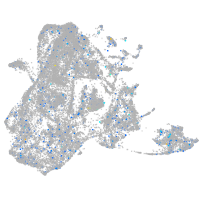
Gene expression UMAP
Display:
Expression
Stage
Other cell groups
all cells
blastomeres
PGCs
endoderm
axial mesoderm
muscle
mural cells /
non-skeletal muscle
mesenchyme
hematopoietic /
vasculature
pronephros
neural
spinal cord / glia
eye
taste / olfactory
otic / lateral line
epidermis
periderm
fin
ionocytes / mucous
pigment cells
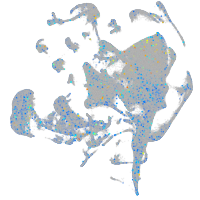
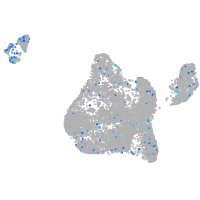
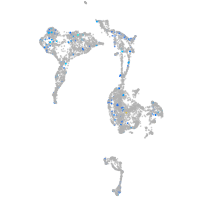
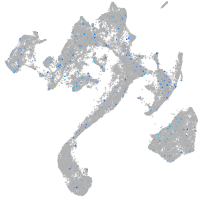
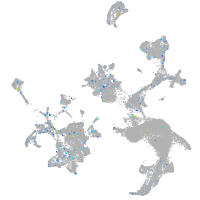
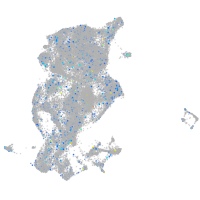
Expression by stage/cluster
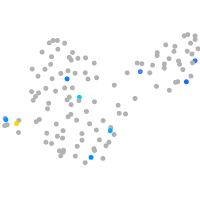
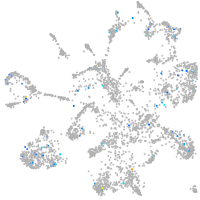
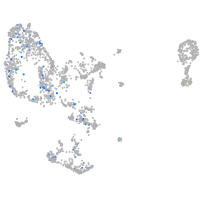
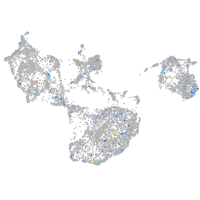
Correlated gene expression
Positive correlation
Negative correlation
Gene
r
Gene
r
LOC795083
0.086
elavl3
-0.028
osmr
0.074
tmsb
-0.027
zmp:0000001267
0.066
myt1b
-0.027
dre-let-7a-1
0.065
zc4h2
-0.027
LOC110438438
0.065
LOC100537384
-0.026
tomt
0.064
h3f3d
-0.025
pimr108
0.064
hmgn6
-0.025
LOC101885769
0.063
si:ch73-1a9.3
-0.025
btr22
0.062
nhlh2
-0.025
LOC570185
0.059
tp53inp2
-0.025
LOC110437898
0.058
ptmab
-0.024
CU013526.1
0.056
jpt1b
-0.024
si:ch73-193i2.2
0.055
si:ch211-222l21.1
-0.024
RF00593
0.053
si:ch73-386h18.1
-0.024
LOC101887068
0.052
scrt2
-0.023
amn
0.050
cdkn1ca
-0.023
si:ch1073-15f19.2
0.048
onecut2
-0.022
LOC108179505
0.048
srrm4
-0.022
LOC101885108
0.047
sox11b
-0.022
htr7a
0.047
dlb
-0.022
eef1a2
0.047
stmn1b
-0.022
LOC108179803
0.047
elovl4a
-0.021
si:zfos-2330d3.1
0.046
ebf2
-0.021
LOC101882826
0.046
hmgb1a
-0.021
il1fma
0.044
hsp90ab1
-0.021
LOC103910804
0.044
lima1a
-0.021
si:ch211-247i17.1
0.044
tmsb4x
-0.021
scpp8
0.044
ywhah
-0.021
zmp:0000001048
0.043
tubb5
-0.020
zgc:158445
0.043
scrt1a
-0.020
slc5a12
0.042
pik3r3b
-0.020
C1orf232
0.042
fscn1a
-0.020
CR626887.1
0.041
faua
-0.020
XLOC-038290
0.041
hmgb3a
-0.020
LOC101882235
0.041
insm1b
-0.020