Daniocell
si:ch73-37h15.2 (mural cells / non-skeletal muscle)
si:ch73-37h15.2
ZFIN
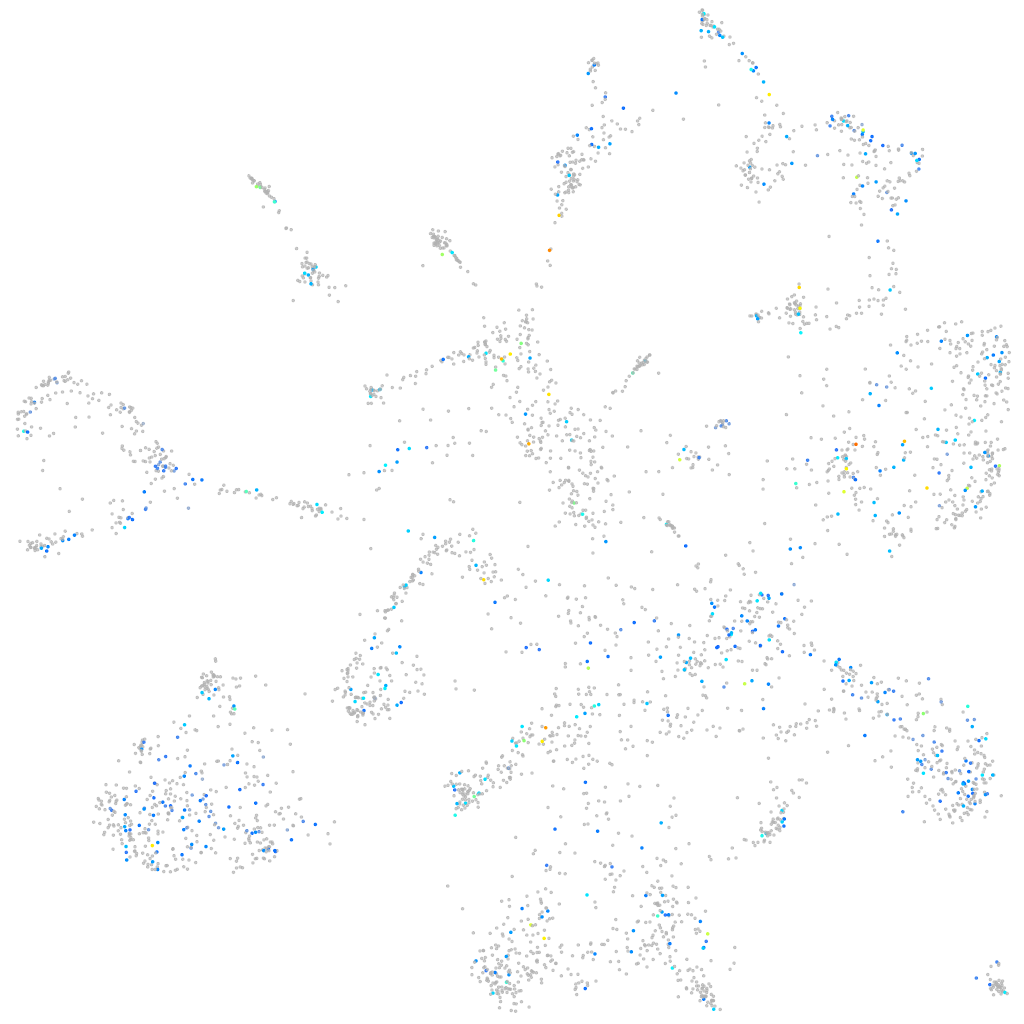
Gene expression UMAP
Display:
Expression
Stage
Other cell groups
all cells
blastomeres
PGCs
endoderm
axial mesoderm
muscle
mural cells /
non-skeletal muscle
mesenchyme
hematopoietic /
vasculature
pronephros
neural
spinal cord / glia
eye
taste / olfactory
otic / lateral line
epidermis
periderm
fin
ionocytes / mucous
pigment cells
Expression by stage/cluster
Correlated gene expression
Positive correlation
Negative correlation
Gene
r
Gene
r
si:ch211-281p14.2
0.124
igfbp7
-0.051
LOC108191486
0.109
tpi1b
-0.045
fhdc4
0.101
pfn1
-0.045
ms4a17a.3
0.100
fxyd1
-0.045
ccdc180
0.100
rbm24a
-0.044
acin1a
0.099
acta2
-0.043
znf1032
0.095
aldob
-0.043
hnrnpa0b
0.095
ak1
-0.043
si:ch73-36p18.1
0.093
kcne4
-0.042
zgc:174356
0.092
inafm2
-0.042
LOC108183289
0.091
ilk
-0.042
XLOC-013608
0.089
tspo
-0.041
hnrnpaba
0.089
tpm1
-0.040
setb
0.089
kng1
-0.040
si:dkey-234i14.3
0.088
plekha8
-0.040
ssh1a
0.088
slc2a1b
-0.039
FO704821.1
0.087
slc26a5
-0.039
LOC793824
0.087
hspb9
-0.038
gucy2c
0.086
pdlim3a
-0.038
nip7
0.086
si:ch211-76l23.4
-0.038
slc38a11
0.085
slc16a3
-0.038
LOC101884156
0.083
zgc:158423
-0.038
hnrnpabb
0.082
tcnba
-0.038
LOC100007738
0.082
dgkg
-0.037
si:ch1073-340j19.1
0.082
pno1
-0.036
zgc:173693
0.082
si:dkey-183i3.5
-0.035
khdrbs1a
0.081
sh3d21
-0.035
LOC110438722
0.081
man1b1a
-0.035
safb
0.081
fam43a
-0.035
nek8
0.081
pex16
-0.034
etf1b
0.081
l3mbtl2
-0.034
gtf2e2
0.080
si:dkey-151g10.3
-0.034
gyg2
0.080
mef2ca
-0.034
lsm12b
0.079
si:ch211-195b13.1
-0.033
SYNDIG1
0.079
pmp22b
-0.033