Daniocell
si:ch73-368j24.14 (taste / olfactory)
si:ch73-368j24.14
ZFIN
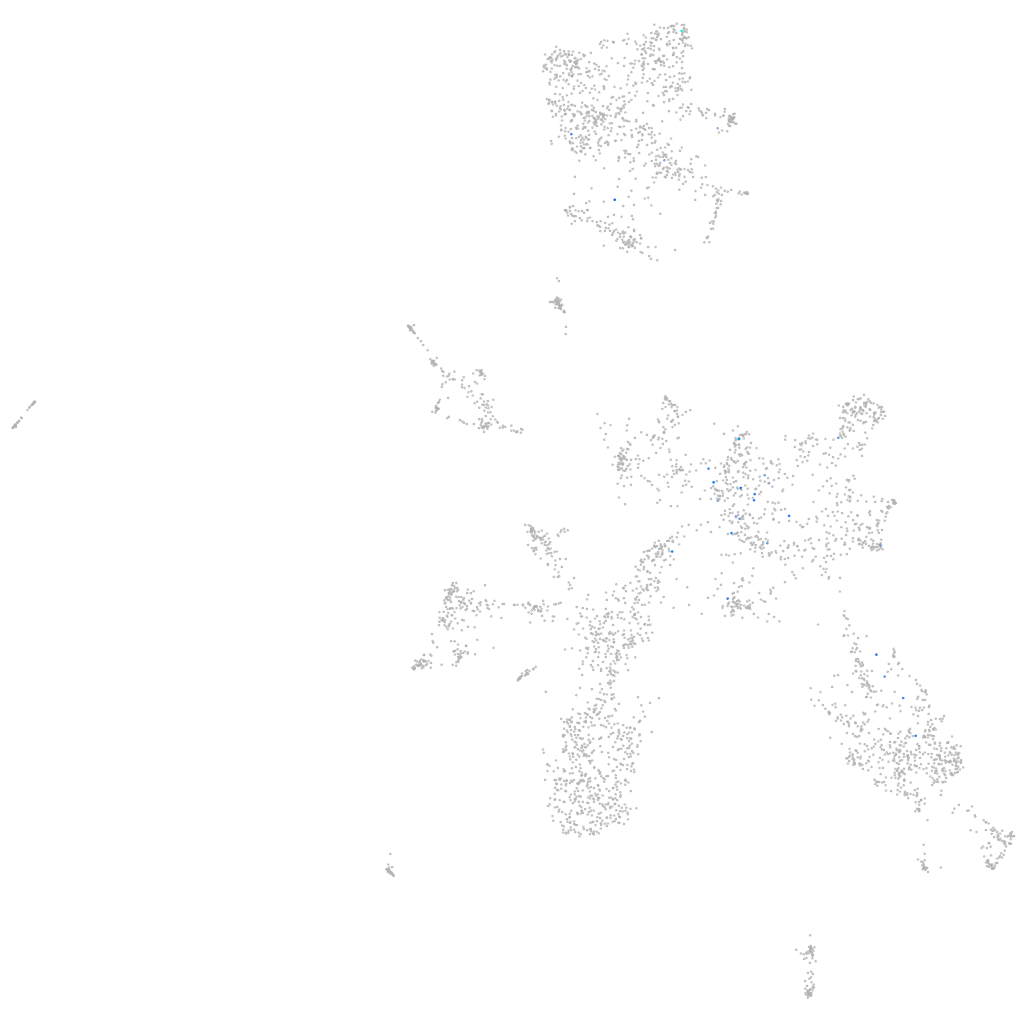
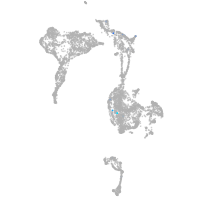
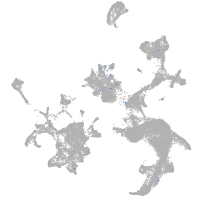
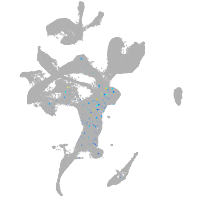
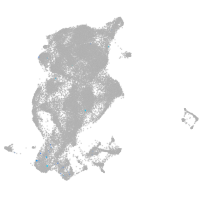
Gene expression UMAP
Display:
Expression
Stage
Other cell groups
all cells
blastomeres
PGCs
endoderm
axial mesoderm
muscle
mural cells /
non-skeletal muscle
mesenchyme
hematopoietic /
vasculature
pronephros
neural
spinal cord / glia
eye
taste / olfactory
otic / lateral line
epidermis
periderm
fin
ionocytes / mucous
pigment cells
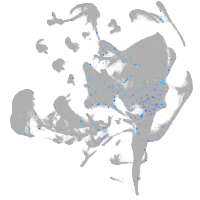
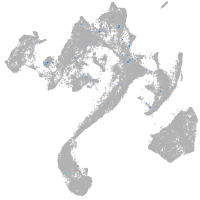
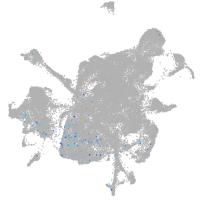
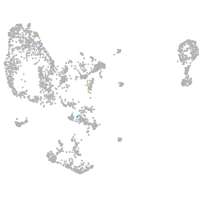
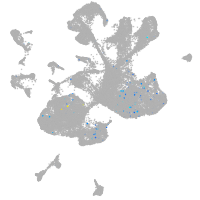
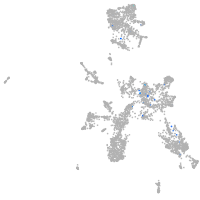
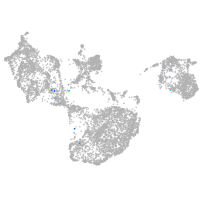
Expression by stage/cluster
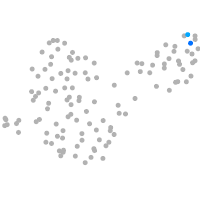
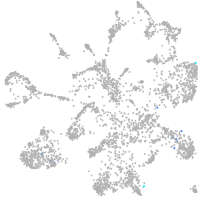
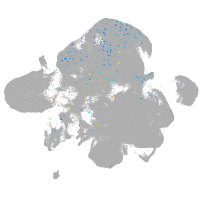
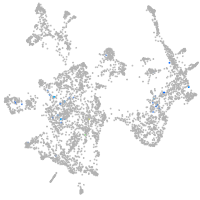
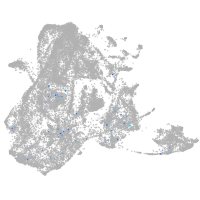
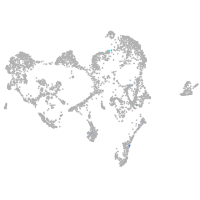
Correlated gene expression
Positive correlation
Negative correlation
Gene
r
Gene
r
LOC103909048
0.296
tmem59
-0.068
si:dkey-3d18.5
0.296
anxa5b
-0.062
zgc:110348
0.242
gnb1a
-0.060
mhc1lfa
0.231
CR383676.1
-0.059
LOC562898
0.229
pvalb5
-0.057
si:ch211-113a14.19
0.225
atp1b1a
-0.056
CABZ01046407.1
0.189
itm2ba
-0.054
si:dkey-1k23.3
0.189
COX3
-0.054
CABZ01070852.1
0.164
gsna
-0.054
si:dkeyp-87d8.8
0.164
smdt1b
-0.053
plcxd2
0.163
txn
-0.052
LOC100149247
0.163
gstp1
-0.051
si:ch211-225k7.2
0.163
selenot1a
-0.051
slc30a8
0.161
selenow1
-0.051
slc29a2
0.159
atp6ap2
-0.050
LOC100332973
0.158
tspan2a
-0.050
taar19m
0.151
si:ch211-153b23.5
-0.050
XLOC-023348
0.150
capns1b
-0.049
si:ch211-243a20.4
0.150
bik
-0.049
fut10
0.150
mt-co1
-0.049
XLOC-015089
0.148
vsig8a
-0.049
tk1
0.147
h1f0
-0.049
CU457819.1
0.144
selenow2b
-0.049
kcnq4
0.143
olfm1b
-0.049
LOC100334916
0.142
nupr1a
-0.049
si:dkey-16n15.6
0.141
chga
-0.048
znf1146
0.140
htatip2
-0.047
smc2
0.140
TSTD1
-0.047
XLOC-019653
0.138
flrt1b
-0.047
tbx5b
0.137
gng13b
-0.047
BX323573.1
0.137
canx
-0.047
LOC110438541
0.136
gng3
-0.046
XLOC-041707
0.136
vamp2
-0.046
recql4
0.136
appa
-0.046
BX649442.1
0.135
adcyap1b
-0.046