Daniocell
 
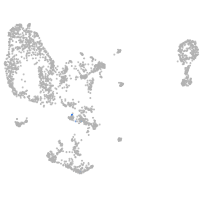
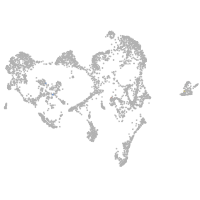
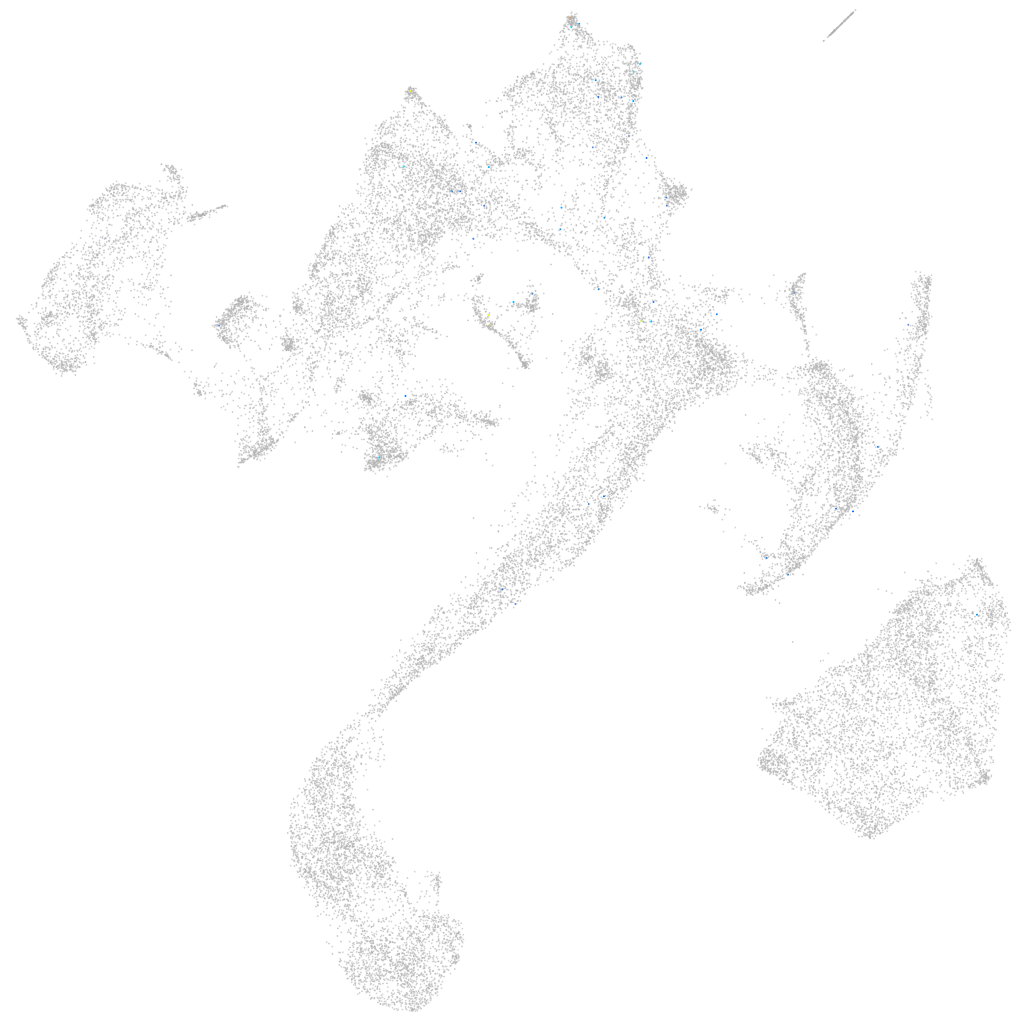
si:ch211-255g12.8 (muscle)
 
si:ch211-255g12.8 ZFIN
Gene expression UMAP Download UMAP
 
 
Other cell groups
all cells
blastomeres
PGCs
endoderm
axial mesoderm

muscle
mural cells /
non-skeletal muscle

mesenchyme
hematopoietic /
vasculature

pronephros
neural
spinal cord / glia
eye
taste / olfactory
otic / lateral line
epidermis
periderm
fin
ionocytes / mucous
pigment cells
Expression by stage/cluster
Correlated gene expression
Positive correlationNegative correlation
GenerGener
CR855320.30.151atp5f1e-0.032
CU862078.10.135cycsb-0.027
si:dkeyp-68b7.120.134cox7b-0.026
cxcl11.50.134atp5md-0.026
AL732567.10.128uqcrh-0.025
CU469584.10.127hspb1-0.024
vmo1a0.119dkc1-0.023
mir4590.118gapdh-0.022
CU695222.20.118c1qbp-0.022
LOC1104388800.108cox5aa-0.022
LOC1081917830.106rrs1-0.021
LOC1081792460.101ckmb-0.021
zgc:558880.100ttn.1-0.020
LOC1018836680.098aldoab-0.020
C1orf2320.091mybphb-0.020
tmem63c0.090cox7c-0.020
LOC100002266.10.089ckma-0.020
zgc:1588680.088tmem38a-0.020
CABZ01078733.10.086neb-0.020
cyp2u10.085atp2a1-0.020
si:ch211-182p11.10.084tpma-0.020
btr290.083ttn.2-0.019
gnrh20.083klhl41b-0.019
CT027805.10.082desma-0.019
si:dkey-159n16.20.079ndufs5-0.019
LOC1018868430.077chchd10-0.019
si:dkey-11e23.90.074snu13b-0.019
lrrc8da0.073acta1b-0.019
ftr300.072atp5if1a-0.019
grtp1b0.071actc1a-0.019
LOC1018821510.071acta1a-0.019
pde1a0.070atp5pf-0.019
ftr340.069tnnt3a-0.019
LOC1003322210.069ndufs4-0.019
esr2b0.067uqcr10-0.019