Daniocell
si:ch211-227n13.3 (periderm)
si:ch211-227n13.3
ZFIN
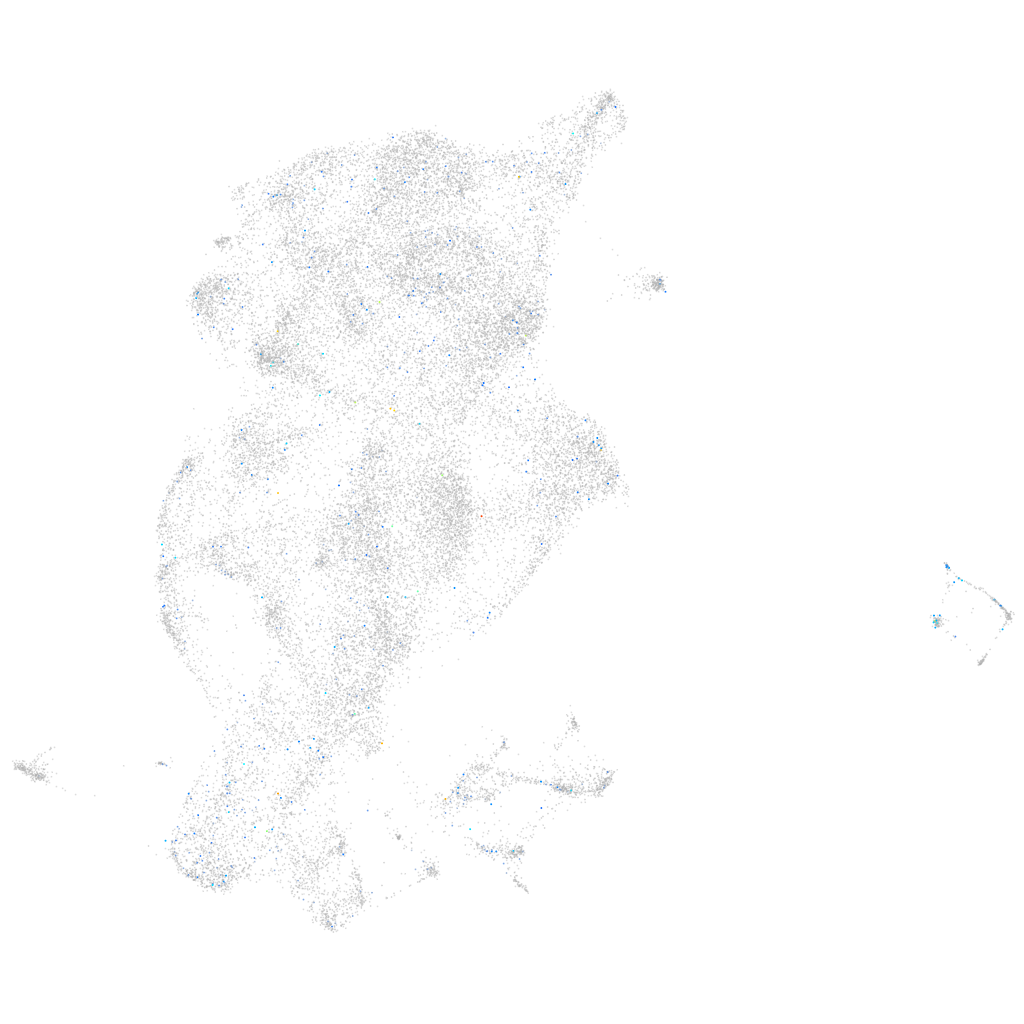
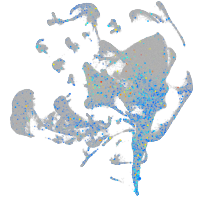
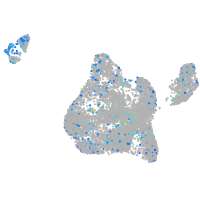
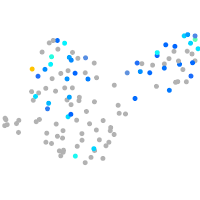
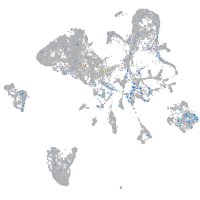
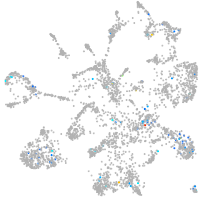
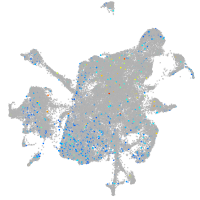
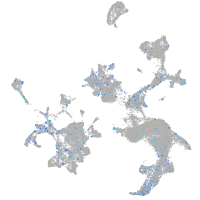
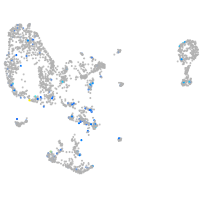
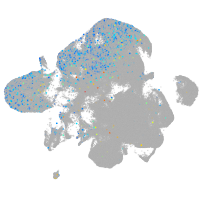
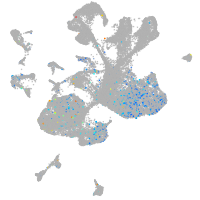
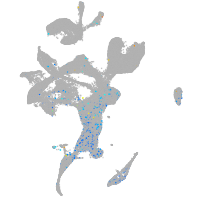
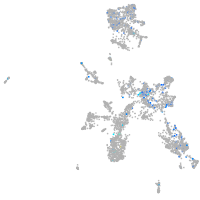
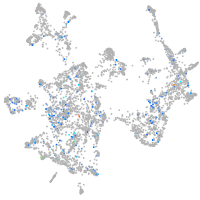
Gene expression UMAP
Display:
Expression
Stage
Other cell groups
all cells
blastomeres
PGCs
endoderm
axial mesoderm
muscle
mural cells /
non-skeletal muscle
mesenchyme
hematopoietic /
vasculature
pronephros
neural
spinal cord / glia
eye
taste / olfactory
otic / lateral line
epidermis
periderm
fin
ionocytes / mucous
pigment cells
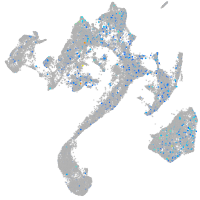
Expression by stage/cluster
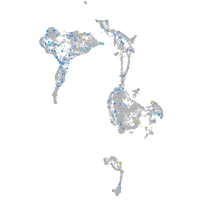
Correlated gene expression
Positive correlation
Negative correlation
Gene
r
Gene
r
BX005073.2
0.135
cyt1
-0.066
si:dkey-37o8.1
0.118
icn2
-0.057
galnt8b.2
0.111
si:ch211-195b11.3
-0.049
CR396584.1
0.109
wu:fb18f06
-0.045
AL929217.1
0.102
krt4
-0.045
zgc:100951
0.100
icn
-0.043
kcnj12a
0.098
rpl37
-0.043
BX005085.1
0.098
cyt1l
-0.040
LOC108183338
0.096
selenow1
-0.039
zgc:77118
0.096
rplp2
-0.037
znf1138
0.095
zgc:193505
-0.035
CR385024.1
0.095
zgc:114188
-0.034
ror1
0.095
rps10
-0.033
si:dkeyp-114g9.1
0.095
tcnbb
-0.033
nanog
0.093
krt5
-0.033
gra
0.092
agr1
-0.029
si:dkey-208k4.2
0.091
rps26l
-0.029
wee2
0.090
rpl36a
-0.029
cyp2aa6
0.089
rps25
-0.026
si:dkey-68o6.5
0.089
rpl26
-0.025
cldnd
0.089
rps29
-0.025
shisa2a
0.089
si:dkeyp-51b9.3
-0.025
larp6b
0.089
krtt1c19e
-0.024
LOC103910804
0.089
rplp1
-0.024
zgc:173742
0.088
anxa1c
-0.024
XLOC-032541
0.088
btf3
-0.024
ccnb2
0.088
rpl9
-0.024
sh3gl3b
0.086
anxa1a
-0.022
acp5a
0.086
rpl35a
-0.021
si:dkeyp-46h3.8
0.086
uba52
-0.021
CU929339.1
0.085
si:dkey-151g10.6
-0.021
noto
0.084
selenow2b
-0.021
cldng
0.083
wu:fa03e10
-0.021
si:dkey-66i24.9
0.082
fbp1a
-0.021
h1m
0.082
ckap4
-0.021