
si:ch211-222l21.1
ZFIN 
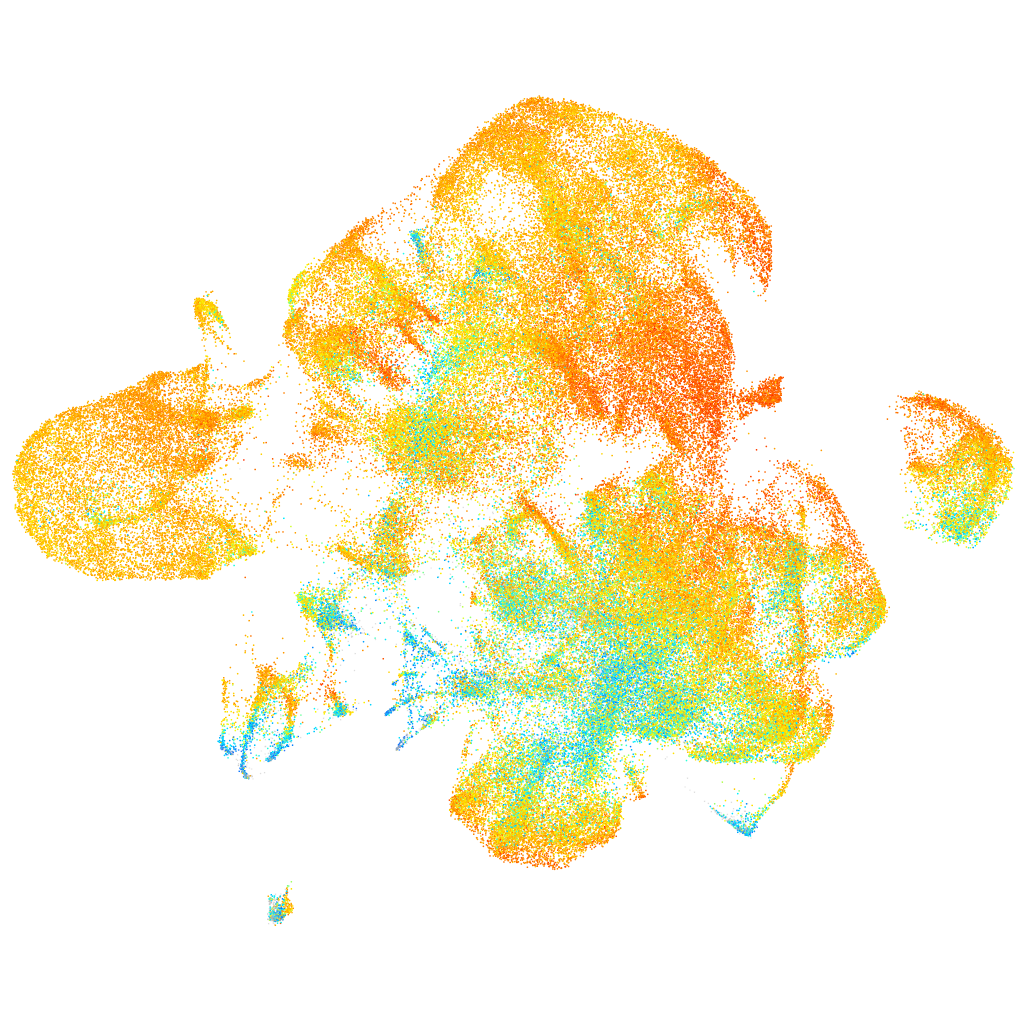
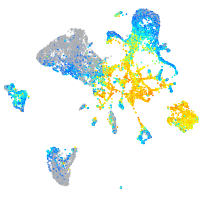
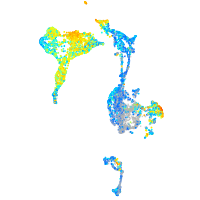
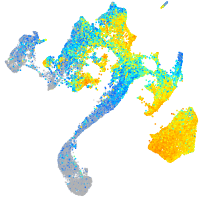
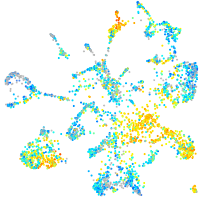
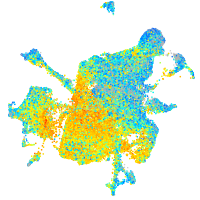
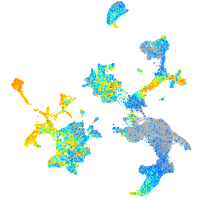
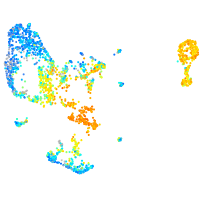
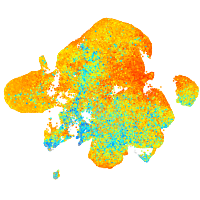
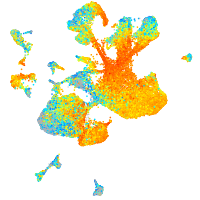
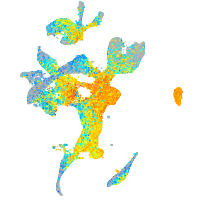
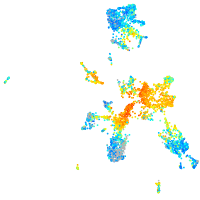
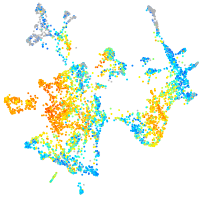
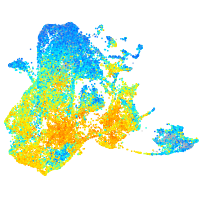
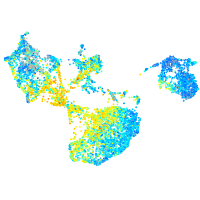
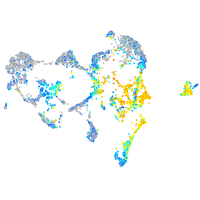
Gene expression UMAP


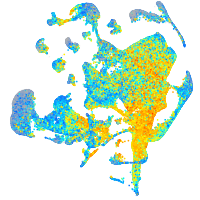
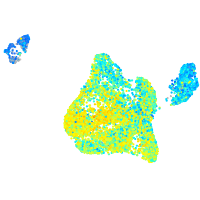
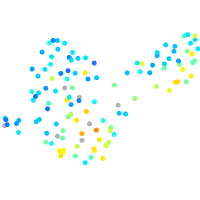
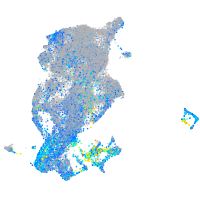
Expression by stage/cluster
Correlated gene expression
| Positive correlation | Negative correlation | ||
| Gene | r | Gene | r |
| hmga1a | 0.542 | atp6v0cb | -0.378 |
| khdrbs1a | 0.501 | sncgb | -0.375 |
| ptmab | 0.490 | sv2a | -0.346 |
| hmgb2b | 0.487 | snap25a | -0.345 |
| h2afvb | 0.482 | nptna | -0.342 |
| hnrnpaba | 0.476 | gapdhs | -0.341 |
| cirbpb | 0.465 | sypb | -0.339 |
| hnrnpabb | 0.433 | syt1a | -0.332 |
| ran | 0.433 | sncb | -0.329 |
| rps12 | 0.431 | calm1b | -0.329 |
| eef1a1l1 | 0.430 | atp2b2 | -0.328 |
| cirbpa | 0.427 | gpm6ab | -0.320 |
| hmgn2 | 0.425 | atp2b3a | -0.318 |
| hmgn6 | 0.418 | eno2 | -0.316 |
| rpsa | 0.416 | stx1b | -0.316 |
| tpt1 | 0.414 | ywhag2 | -0.316 |
| rplp2l | 0.407 | sypa | -0.315 |
| rps20 | 0.404 | cpe | -0.311 |
| seta | 0.403 | atp1a3a | -0.310 |
| rps9 | 0.400 | atp2b3b | -0.310 |
| ybx1 | 0.398 | atpv0e2 | -0.305 |
| hdac1 | 0.395 | map1aa | -0.304 |
| rpl13 | 0.395 | vsnl1b | -0.301 |
| rpl7a | 0.395 | atp6ap2 | -0.300 |
| rpl27 | 0.393 | syt2a | -0.299 |
| hmgb2a | 0.391 | syngr3a | -0.297 |
| rpl13a | 0.390 | cplx2 | -0.297 |
| rps5 | 0.389 | stmn2a | -0.297 |
| rpl12 | 0.389 | stxbp1a | -0.296 |
| rps8a | 0.389 | nrxn1a | -0.294 |
| rps19 | 0.387 | eno1a | -0.294 |
| rpl11 | 0.387 | rab6bb | -0.294 |
| si:ch211-288g17.3 | 0.387 | slc6a1a | -0.294 |
| ddx39ab | 0.386 | aldocb | -0.291 |
| snrpf | 0.386 | elavl4 | -0.289 |