Daniocell
si:ch211-152f23.5 (mesenchyme)
si:ch211-152f23.5 [Source:ZFIN;Acc:ZDB-GENE-080917-47]
ZFIN
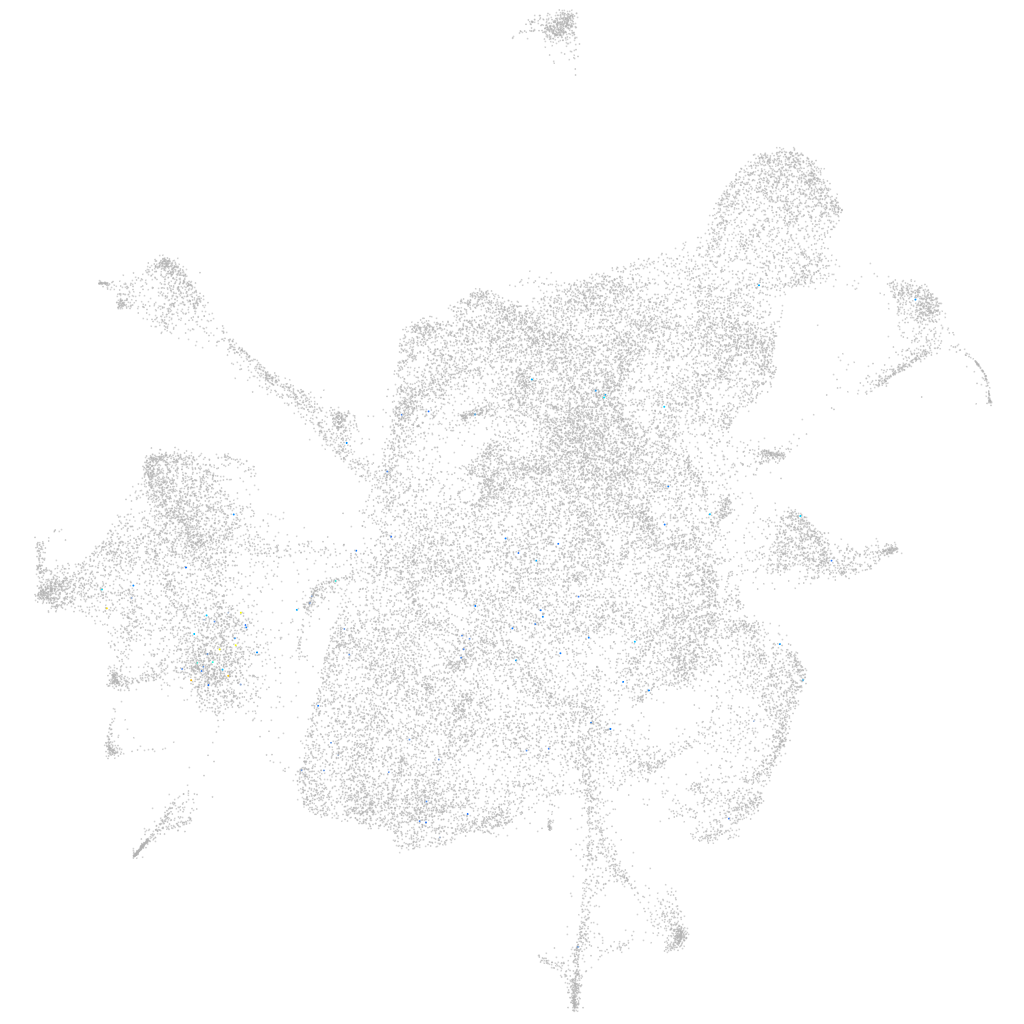
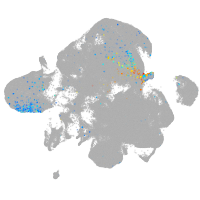
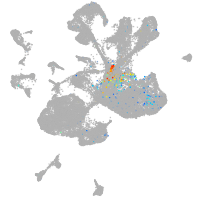
Gene expression UMAP
Display:
Expression
Stage
Other cell groups
all cells
blastomeres
PGCs
endoderm
axial mesoderm
muscle
mural cells /
non-skeletal muscle
mesenchyme
hematopoietic /
vasculature
pronephros
neural
spinal cord / glia
eye
taste / olfactory
otic / lateral line
epidermis
periderm
fin
ionocytes / mucous
pigment cells
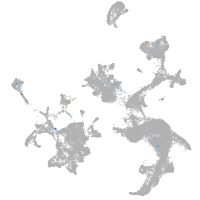
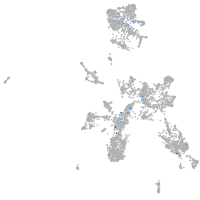
Expression by stage/cluster
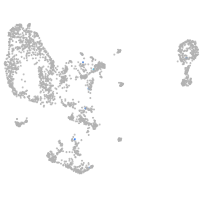
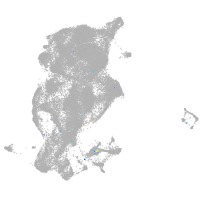
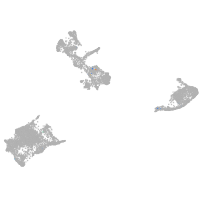
Correlated gene expression
Positive correlation
Negative correlation
Gene
r
Gene
r
CU652528.1
0.148
rps8a
-0.020
LOC110439792
0.134
naca
-0.016
cfap43
0.131
rpl9
-0.016
gata1b
0.128
eef1da
-0.014
or106-6
0.101
sparc
-0.014
morn3
0.097
rplp2
-0.014
mir196b
0.096
rpl15
-0.014
si:dkey-11o1.3
0.092
mmp14a
-0.014
or106-11
0.090
angptl1a
-0.014
BX323076.1
0.087
rack1
-0.014
CABZ01064441.1
0.086
cbr1l
-0.013
ugt5a2
0.083
hapln1a
-0.013
slc34a1b
0.082
rps3a
-0.013
dla
0.079
pmp22a
-0.013
her13
0.078
fbn2b
-0.013
hbba2
0.077
tspan4a
-0.013
LOC103910960
0.076
vdac2
-0.012
CR385041.1
0.075
LOC108179343
-0.012
LOC110439493
0.074
serinc1
-0.012
CABZ01040021.1
0.070
rps17
-0.012
si:ch211-226m7.4
0.069
lama4
-0.012
si:ch211-209f23.7
0.067
idh3a
-0.012
inavaa
0.067
stx5a
-0.012
gadd45gb.1
0.065
COX3
-0.012
si:ch211-250n8.1
0.065
cnmd
-0.012
CABZ01083546.1
0.065
fstl3
-0.012
si:ch211-191a16.5
0.062
gpia
-0.012
si:ch211-264e16.2
0.060
txndc15
-0.011
XLOC-000817
0.059
ms4a17a.11
-0.011
cyp2k17
0.058
tnrc6c1
-0.011
her4.2
0.057
ier2a
-0.011
si:ch73-21g5.7
0.056
MDFI
-0.011
cntrob
0.056
timm23a
-0.011
TIMM22
0.055
rpl35
-0.011
BX530077.1
0.054
pinx1
-0.011