Daniocell
si:ch1073-416d2.4 (fin)
si:ch1073-416d2.4
ZFIN
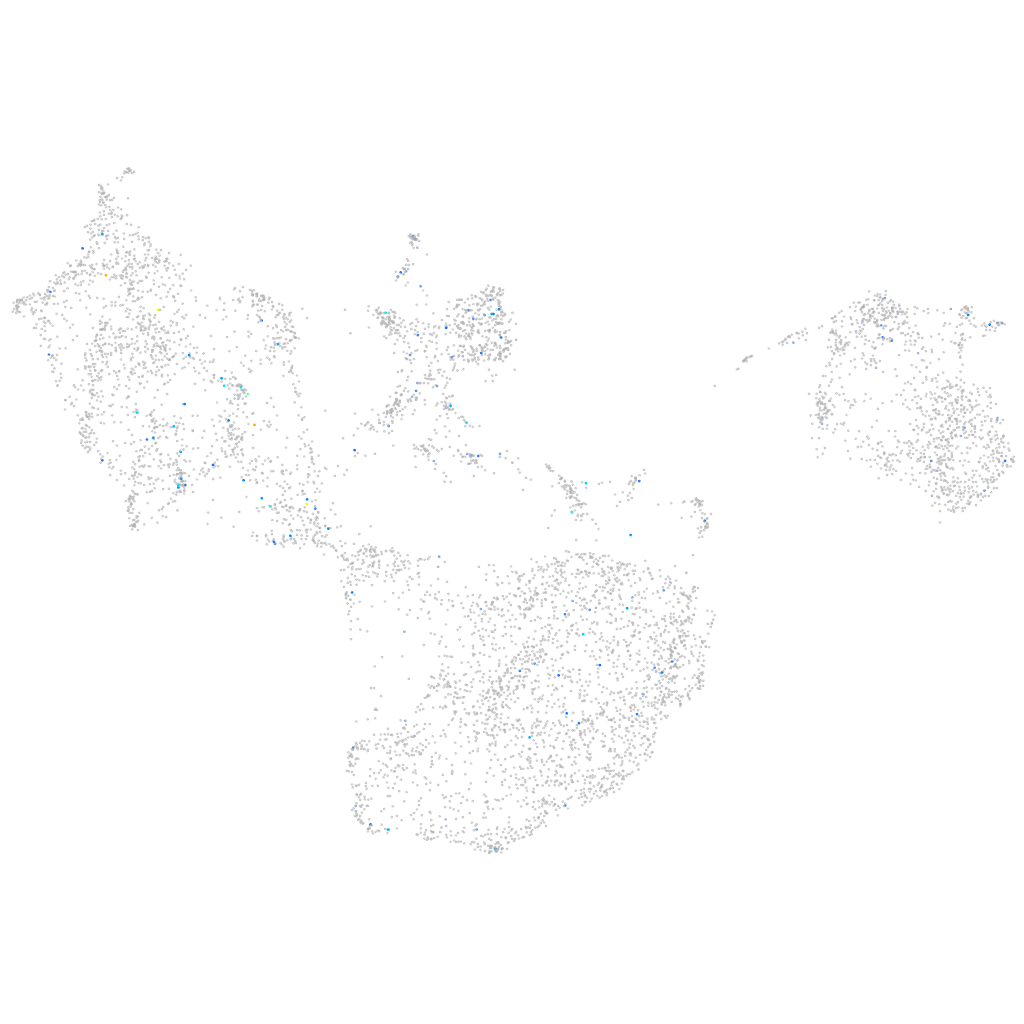
Gene expression UMAP
Display:
Expression
Stage
Other cell groups
all cells
blastomeres
PGCs
endoderm
axial mesoderm
muscle
mural cells /
non-skeletal muscle
mesenchyme
hematopoietic /
vasculature
pronephros
neural
spinal cord / glia
eye
taste / olfactory
otic / lateral line
epidermis
periderm
fin
ionocytes / mucous
pigment cells
Expression by stage/cluster
Correlated gene expression
Positive correlation
Negative correlation
Gene
r
Gene
r
AL772373.1
0.228
tmsb4x
-0.053
BX323861.3
0.210
krt4
-0.045
pop1
0.191
wu:fb18f06
-0.045
si:dkey-66g10.2
0.191
and2
-0.044
elnb
0.191
s100a10b
-0.044
si:ch211-197e7.3
0.186
tmsb1
-0.044
BX248521.2
0.184
pycard
-0.044
znf980
0.163
pfn1
-0.043
fhad1
0.162
tpm3
-0.043
LOC103911188
0.160
myh9a
-0.043
si:dkeyp-73a2.2
0.159
gpa33a
-0.043
grn1
0.153
icn
-0.043
LOC100535162
0.149
ecrg4b
-0.042
XLOC-026336
0.140
spaca4l
-0.042
XLOC-001602
0.139
cfl1l
-0.042
slc35f3a
0.137
ywhaz
-0.042
si:ch211-222f23.6
0.136
cyt1
-0.042
BX293559.2
0.133
hcls1
-0.041
zgc:154046
0.132
si:dkey-248g15.3
-0.041
BX842699.1
0.131
cotl1
-0.041
nos2b
0.131
aqp3a
-0.041
BX649485.2
0.128
si:dkey-102c8.3
-0.041
c1qb
0.124
thy1
-0.040
cabp1b
0.124
flna
-0.040
si:ch211-202h22.9
0.117
anxa1a
-0.039
mfsd4ab
0.114
cldn1
-0.039
spartb
0.112
krt97
-0.039
cfap52
0.112
tp63
-0.039
LOC101886077
0.112
myl12.1
-0.038
LOC101884613
0.111
and1
-0.038
CR407561.1
0.109
cyt1l
-0.038
LOC110437924.1
0.108
zgc:153284
-0.038
ccl19a.1
0.108
egfl6
-0.038
cd28
0.107
arpc5b
-0.037
CABZ01074708.1
0.107
rbp4
-0.037