Daniocell
si:ch1073-416d2.4 (epidermis)
si:ch1073-416d2.4
ZFIN
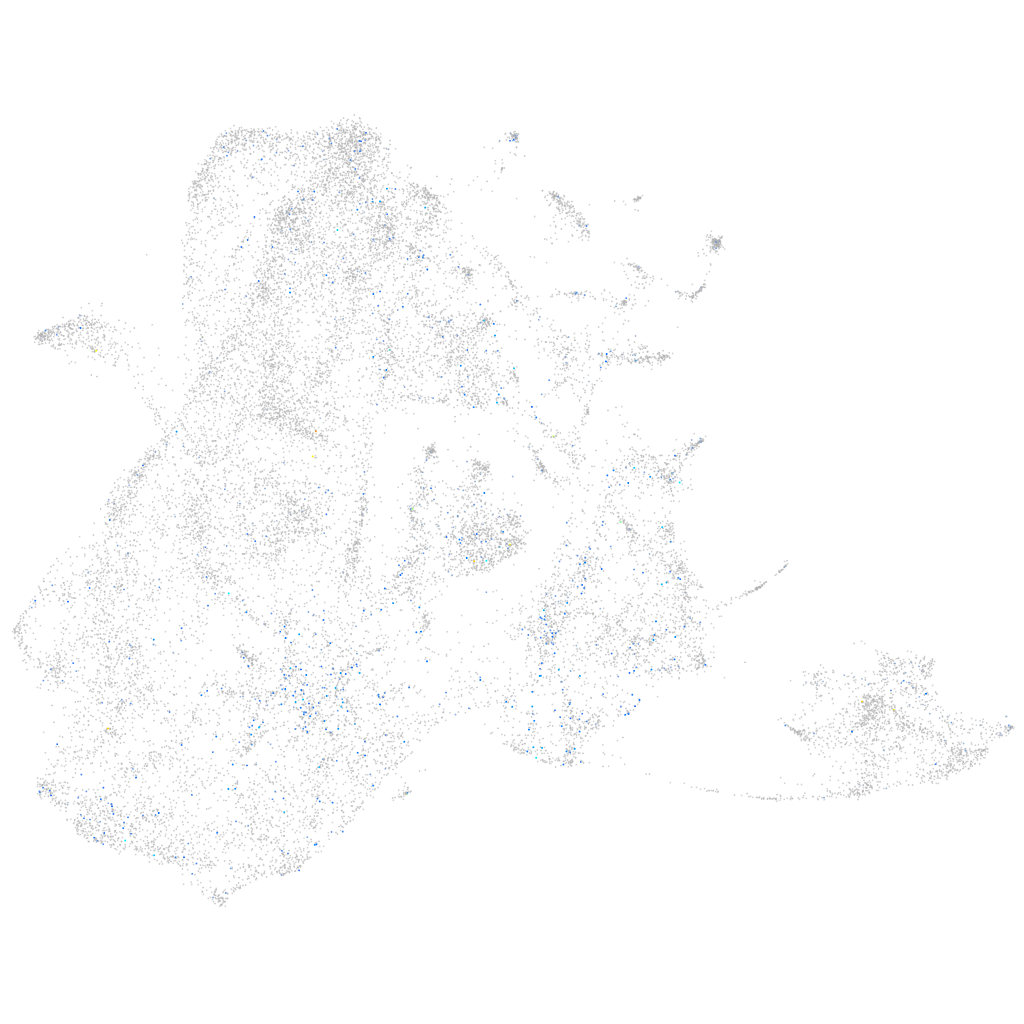
Gene expression UMAP
Display:
Expression
Stage
Other cell groups
all cells
blastomeres
PGCs
endoderm
axial mesoderm
muscle
mural cells /
non-skeletal muscle
mesenchyme
hematopoietic /
vasculature
pronephros
neural
spinal cord / glia
eye
taste / olfactory
otic / lateral line
epidermis
periderm
fin
ionocytes / mucous
pigment cells
Expression by stage/cluster
Correlated gene expression
Positive correlation
Negative correlation
Gene
r
Gene
r
LOC103910498
0.127
krt4
-0.098
si:ch211-226m7.4
0.116
cyt1
-0.094
gys2
0.113
tmsb1
-0.092
LOC101882606
0.112
s100a10b
-0.087
LOC103909470
0.099
pfn1
-0.077
cyp19a1a
0.097
capns1a
-0.075
fndc7a
0.094
cfl1l
-0.071
LOC110437943
0.093
col1a1b
-0.069
si:cabz01036022.1
0.087
cyt1l
-0.068
si:ch211-219a15.3
0.086
cap1
-0.067
LOC103910264
0.086
col11a1a
-0.066
LOC101882499
0.086
col1a1a
-0.066
ttc34
0.085
krt5
-0.066
hmgb1b
0.084
cotl1
-0.065
si:dkey-42i9.4
0.084
anxa1a
-0.064
six1b
0.083
krtt1c19e
-0.064
si:ch211-163l21.10
0.083
aep1
-0.063
dnaaf3
0.083
col1a2
-0.063
khdrbs1a
0.083
postnb
-0.063
kcnk12l
0.083
wu:fb18f06
-0.062
si:ch211-276a23.5
0.082
spaca4l
-0.059
LOC103908846.1
0.081
krt91
-0.059
zgc:92590
0.080
col2a1b
-0.058
TMEM114
0.079
zgc:153284
-0.058
znfl1g
0.079
actb1
-0.058
fbxo36b
0.078
rbp4
-0.058
h2afva
0.077
tmsb4x
-0.057
rbm4.1
0.077
gapdhs
-0.056
hnrnpabb
0.076
tuba8l2
-0.055
ran
0.075
ecrg4b
-0.055
hmgb2b
0.075
si:dkey-16p21.8
-0.055
h3f3d
0.074
zgc:162730
-0.055
cirbpb
0.074
lgals1l1
-0.054
sox11b
0.073
wu:fa03e10
-0.054
CR854927.3
0.072
aqp3a
-0.054