Daniocell
si:cabz01063885.1 (blastomeres)
si:cabz01063885.1
ZFIN
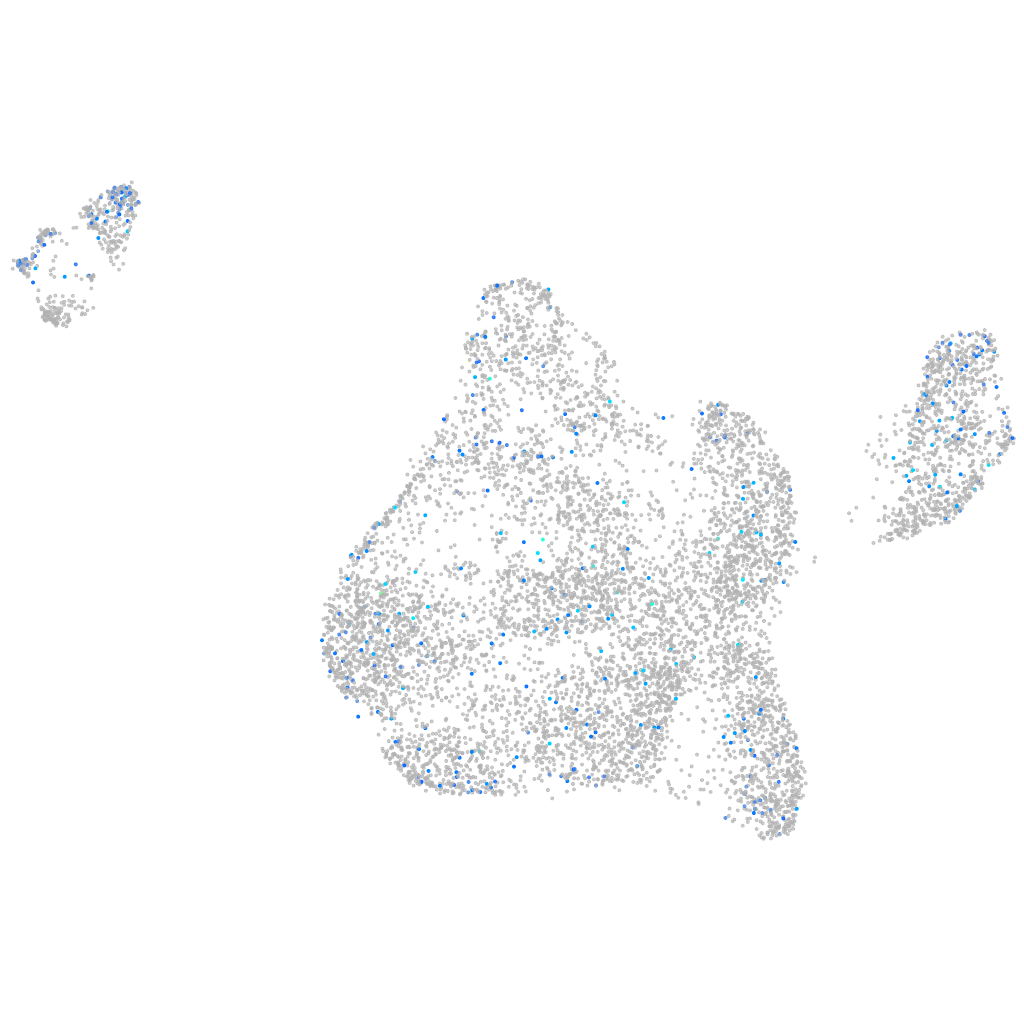
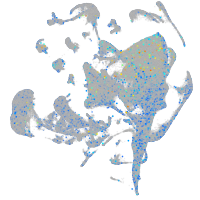
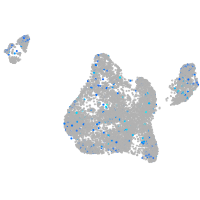
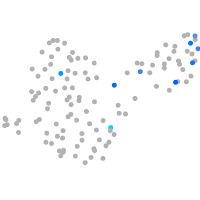
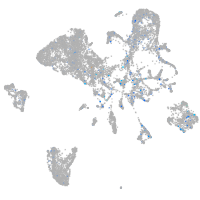
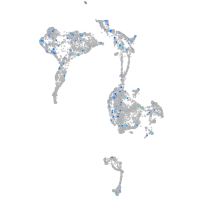
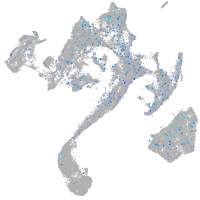
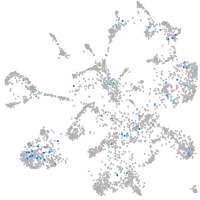
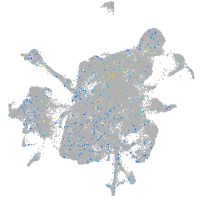
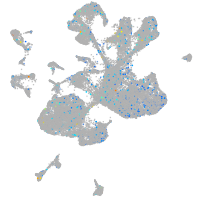
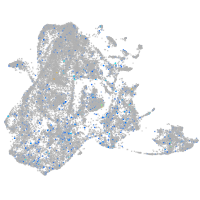
Gene expression UMAP
Display:
Expression
Stage
Other cell groups
all cells
blastomeres
PGCs
endoderm
axial mesoderm
muscle
mural cells /
non-skeletal muscle
mesenchyme
hematopoietic /
vasculature
pronephros
neural
spinal cord / glia
eye
taste / olfactory
otic / lateral line
epidermis
periderm
fin
ionocytes / mucous
pigment cells
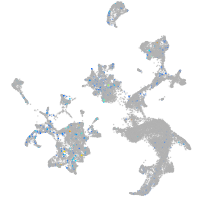
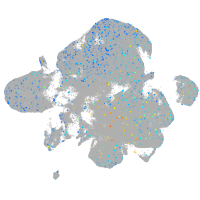
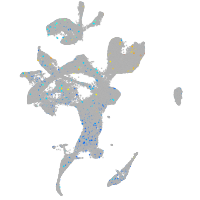
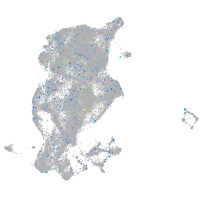
Expression by stage/cluster
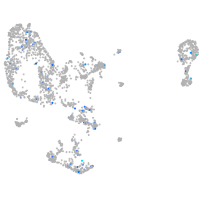
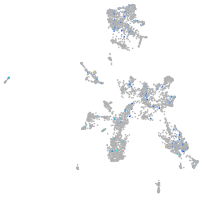
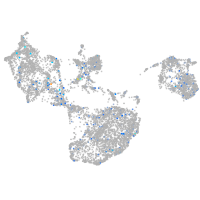
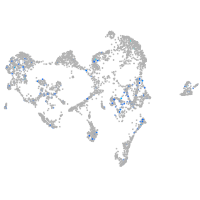
Correlated gene expression
Positive correlation
Negative correlation
Gene
r
Gene
r
zgc:162948
0.146
si:ch211-222l21.1
-0.065
tigara
0.101
hmgb2a
-0.064
dyrk4
0.098
akap12b
-0.063
LOC108182577
0.091
si:ch73-1a9.3
-0.061
XLOC-013197
0.087
stm
-0.060
XLOC-043020
0.085
marcksl1b
-0.058
ccdc124
0.084
hmgn6
-0.058
XLOC-035243
0.084
si:ch211-152c2.3
-0.057
si:ch211-191a24.4
0.081
dynll1
-0.055
cldnd
0.081
eef1a1l1
-0.055
XLOC-036545
0.080
NC-002333.4
-0.055
BX324216.1
0.079
polr3gla
-0.054
slc25a25a
0.079
rplp1
-0.052
ska2
0.078
hspb1
-0.050
BX005313.1
0.078
rps24
-0.049
inafm2
0.077
hnrnpa0b
-0.048
tent5c
0.077
aldob
-0.048
spink2.1
0.076
ncl
-0.047
LOC101886384
0.076
si:dkey-151g10.6
-0.046
EGFLAM
0.076
pou5f3
-0.046
gtf2a1
0.076
rps2
-0.045
h2af1al
0.075
khdrbs1a
-0.045
mknk2a
0.075
zgc:110425
-0.045
LOC110437773
0.074
npm1a
-0.045
ccdc186
0.074
rpl32
-0.044
mid1ip1l
0.074
rps15a
-0.044
cth1
0.074
rpl36a
-0.044
traf4b
0.074
rpl11
-0.043
XLOC-010379
0.073
rps6
-0.043
LOC110438508
0.073
rpl27
-0.043
prrg2
0.072
anp32e
-0.043
fam114a2
0.072
mrto4
-0.043
zgc:111868
0.072
rpl39
-0.042
fam69ab
0.071
snrpd1
-0.042
si:ch211-147a11.3
0.071
nop2
-0.042